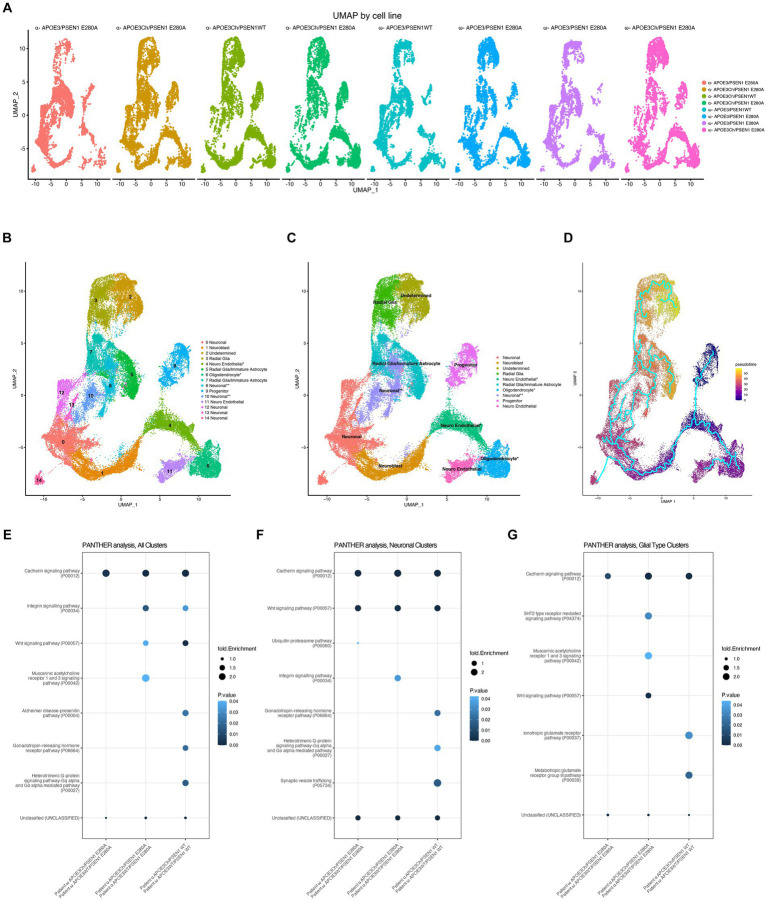
Figure 3.
Cell line scRNA-seq UMAP cluster characteristics. scRNAseq data were downsampled and integrated using SCTransform and Harmony. Individual cell line UMAPs show an overlap, indicating that integration was successful (A). Cell cluster transcript lists were run through GSEA C8 Cell Type for cluster identity (B). * represents cell cluster identities defined by the second highest hit in GSEA C8 Cell Type analysis and the post hoc transcript expression profile, while ** represents cell cluster identities defined by post hoc transcript expression profiles. Similar cluster identities were combined to form reference groups for downstream analysis (C). Asterisk denotes cell cluster identity that was second hit in fGSEA due to its better representation of transcriptomic profile and differentiation protocol used (B,C). Pseudotime was performed using the Monocle analysis suite to represent the differentiation timing to cell identity, initiating the analysis at Cluster 9 (Progenitor) as time zero (D). PANTHER pathways analysis was performed on total cells, all clusters (E), neuronal clusters 0, 1, 8, 10, 12, 13, and 14 (F), and glia-type clusters 3, 5, and 7 (G).

