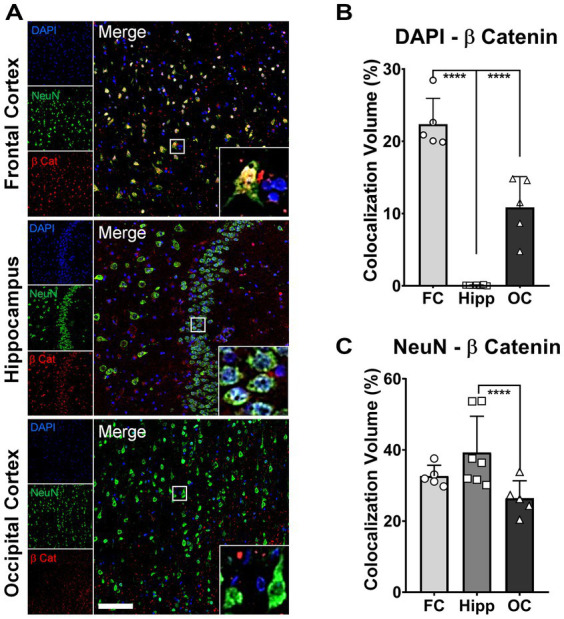
Figure 5.

Increased nuclear β-catenin in neurons of protected brain regions of patient α. Representative immunofluorescence (IF) micrographs of the frontal cortex (FC), hippocampus (Hipp), and occipital cortex (OC) stained for β-catenin (red), NeuN (green), and cell nuclei (DAPI, blue). Insets present magnified images of neurons showing the degree of colocalization between the three markers. Scale bar = 100 μm. (A). Bar graphs for colocalization analysis depicting thresholded colocalization volumes (TCVs) between DAPI and β-catenin in FC, Hipp, and OC. The percentage of β-catenin colocalizing in nuclei is significantly higher in FC than in both structures, Hipp and OC (one-way ANOVA, p < 0.0001 for both) (B). Bar graphs for colocalization analysis depicting TCVs between DAPI and β-catenin in FC, Hipp, and OC. The percentage of β-catenin colocalizing with neurons is significantly higher only in Hipp when compared to OC (one-way ANOVA, p = 0.025) (C).
