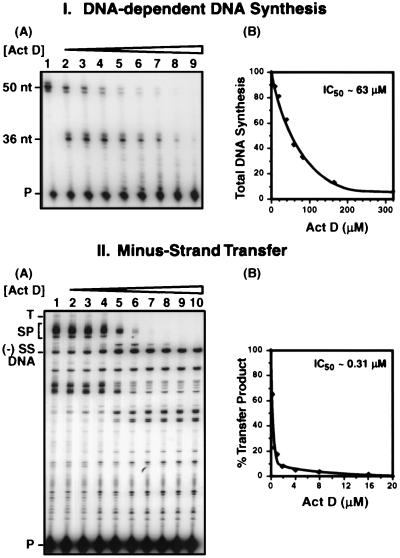
FIG. 1.
Selective inhibition of strand transfer by Act D. Reactions and analysis of DNA products were performed as described in Materials and Methods. (I) DNA-dependent DNA synthesis. (A) Gel analysis. The concentrations of Act D were as follows: lane 1, no drug; lane 2, 5 μM; lane 3, 10 μM; lane 4, 20 μM; lane 5, 40 μM; lane 6, 60 μM; lane 7, 80 μM; lane 8, 160 μM; and lane 9, 320 μM. The positions of the 36- and 50-nt products and the primer (P) are shown on the left. (B) Quantitative PhosphorImager analysis of gel data. The total amount of DNA synthesis (with the control value set at 100%) was plotted as a function of Act D concentration. (II) Minus-strand transfer. (A) Gel analysis. The concentrations of Act D used were as follows: lane 1, no drug; lane 2, 0.25 μM; lane 3, 0.5 μM; lane 4, 1 μM; lane 5, 2 μM; lane 6, 4 μM; lane 7, 8 μM; lane 8, 12 μM; lane 9, 16 μM; and lane 10, 20 μM. The positions of (−) SSDNA, the transfer product (T), SP DNAs (SP) (28), and primer are shown on the left. (B) Quantitative PhosphorImager analysis of gel data. To compare the amount of transfer product made in control and Act D-containing reaction mixtures, the percent transfer product represented in total DNA products was quantified for each reaction (with the control value set at 100%) and was plotted against the concentration of Act D.

