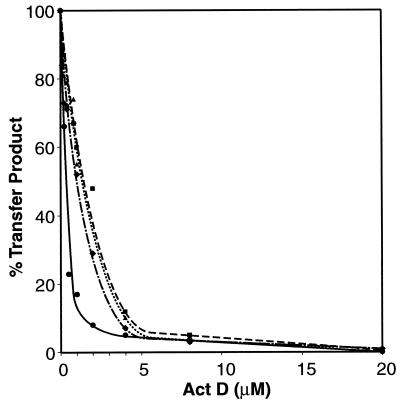
FIG. 2.
Effect of Act D on NC-catalyzed minus-strand transfer. Reactions were carried out in the presence of NC and Act D, as indicated, according to the procedures detailed in Materials and Methods. The data shown for reactions without NC were taken from Fig. 1, panel IIB. The percent transfer product represented in total DNA products was quantified with a PhosphorImager and was plotted against the concentration of Act D as described in the legend to Fig. 1, panel IIB. Symbols: circles, solid line, no NC; diamonds, dot-dash line, 0.4 μM NC; triangles, dotted line, 0.8 μM NC; and squares, dashed line, 1.6 μM NC.

