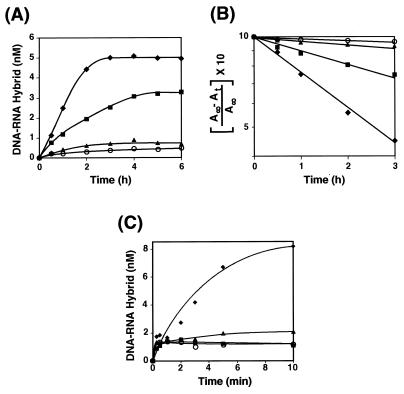
FIG. 6.
Effect of Act D on the kinetics of annealing of (−) SSDNA and acceptor RNA in the absence or presence of NC protein. In the absence of NC (A and B), the annealing reaction was carried out with Act D (as indicated), as described in Materials and Methods. Aliquots were removed for gel analysis at 0.5, 1, 2, 3, 4, 5, and 6 h. In panel C, reaction mixtures were preincubated with Act D (as indicated) for 10 min at 37°C prior to the addition of NC. Aliquots were removed for gel analysis at 0.25, 0.5, 1, 2, 3, 5, and 10 min. (A) Quantitative PhosphorImager analysis of annealing in the absence of NC. The concentration of the DNA-RNA hybrid was plotted against the time of incubation. (B) Kinetic plot of the PhosphorImager data. The data from panel A were plotted as a semilogarithmic plot of the concentration of hybrid formed with time (35). A∞ and At are the concentrations of hybrid formed at infinite time and at the indicated time, respectively. A∞ is a theoretical value; At was determined by PhosphorImager analysis of the gel data. (C) Quantitative PhosphorImager analysis of annealing in the presence of 0.4 μM NC. The concentration of the DNA-RNA hybrid was plotted against the time of incubation. Since the reactions performed in the presence of Act D and NC showed little or no progression to final hybridization after the first 15 to 30 s, the data did not lend themselves to a kinetic analysis. Symbols for panels A and B: diamonds, no drug; squares, 0.5 μM Act D; triangles, 1 μM Act D; circles, 8 μM Act D. Symbols for panel C: diamonds, no drug; squares, 1 μM Act D; triangles, 2 μM Act D; circles, 16 μM Act D.

