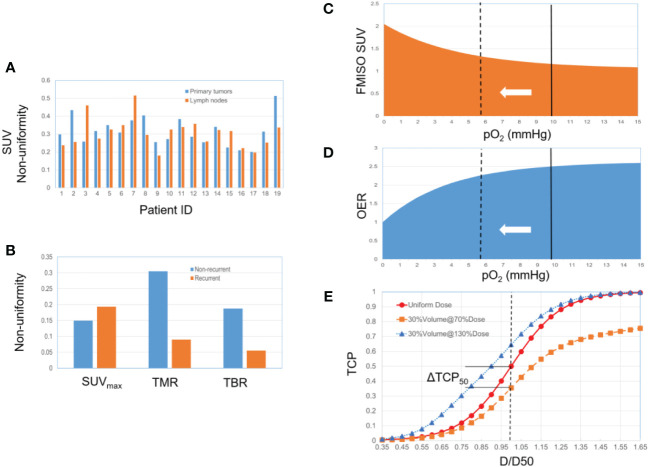
Figure 1.
(A) 19 HNSCC patients, primary tumors and lymph nodes (from ref 45). (B) 22 NSCLC patients, non-recurrent group (13 patients) and recurrent group (9 patients) (from ref 46). (C) Relationship between FMISO SUV and pO2. The solid line represents the selected baseline reference (pO2 = 10 mmHg). The dotted line represents the hypoxic state, corresponding to a higher SUV and a lower OER. (D) Relationship between OER and pO2. (E) The TCP dose-response curve (a sigmoid function) changes along with the hypoxic condition and associated radio-sensitivity.

