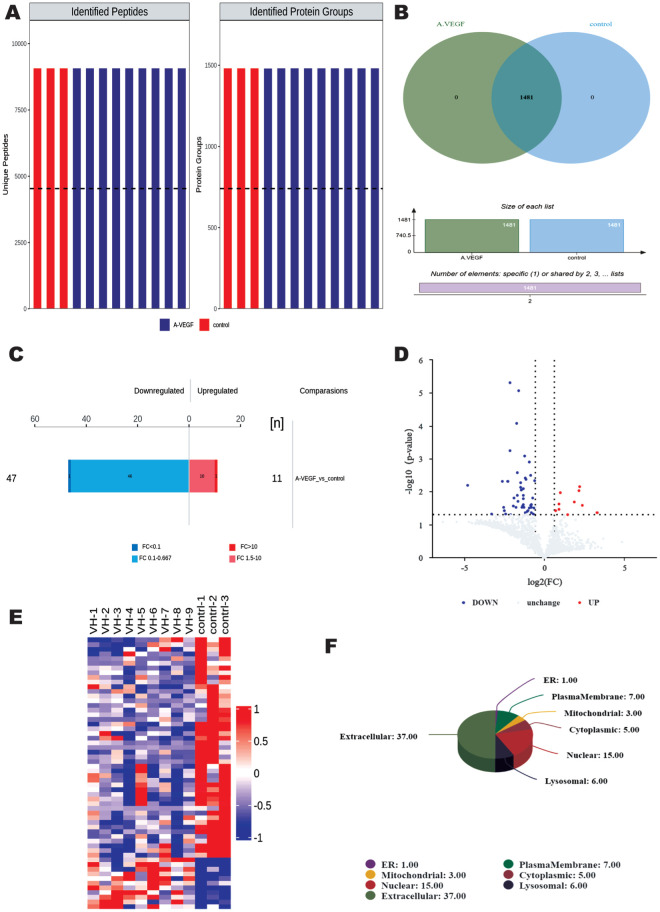
Figure 1. Results of DEPs analysis.
A: Total number of identified peptides and identified proteins; Different colours represent different groups; B: VENN plot showing the number of proteins identified in each group. C: Histogram of quantitative protein difference results. D: Histogram of quantitative protein difference results. E: Volcano plot showing significantly DEPs. Up- and down-regulated DEPs are shown in red and blue, respectively. F: All (DEPs) were analyzed for subcellular localization. DEP: Differentially expressed proteins.

