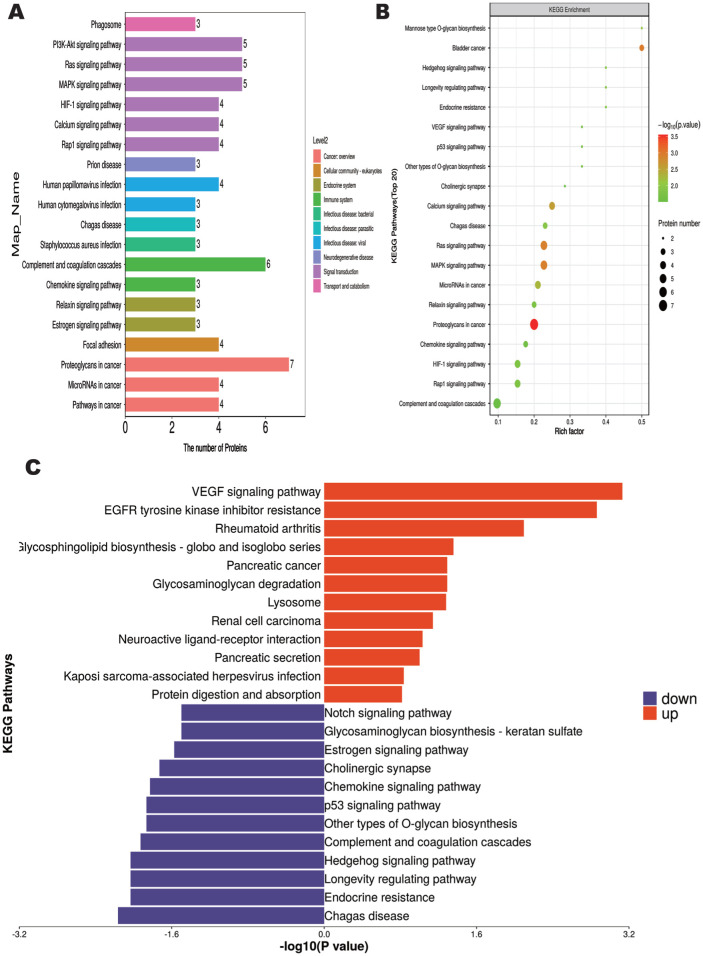
Figure 3. KEGG pathway enrichment analysis.
A: KEGG pathway annotation and attribute histogram of DEPs; Different colors represent the 7 branches of the KEGG metabolic pathway. B: KEGG pathway enrichment bubble plot; C: Butterfly diagram of up- and down-regulated DEPs. KEGG: Kyoto Encyclopedia of Genes and Genomes; DEP: Differentially expressed proteins.

