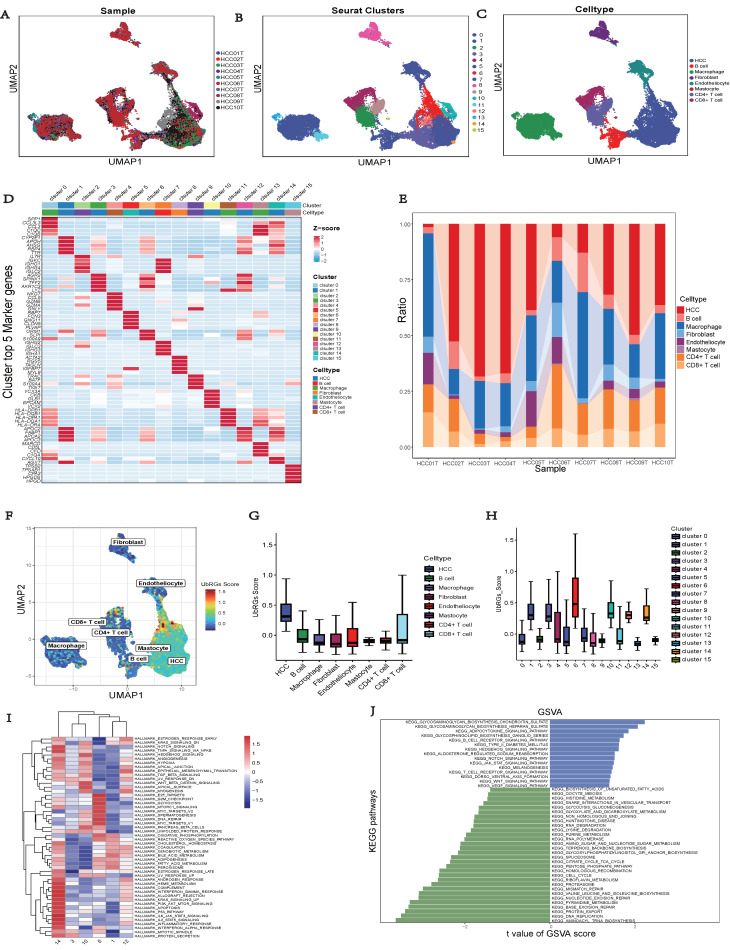
Figure 10.
Single-cell analysis of HCC sample. (A) Different samples in the HCC dataset. (B) 34,061 cells belonging to sixteen cell clusters in ten HCC samples. (C) Different cell types. (D) Heatmap showing the expression of the top five marker genes for each cluster. (E) Frequency distribution of cell types across ten samples. (F) UMAP visualization of UbRGs expression in different cell subsets. (G) Boxplots illustrating the scores of UbRGs in different cell clusters. (H) Boxplots illustrating the scores of hub UbRGs in different cell clusters. (I) Heatmap showing different hallmark pathways enriched in HCC cell clusters by GSVA. (J) Differences in KEGG pathway activities scored per HCC cell by GSVA between hub UbRGs high and low score cells.

