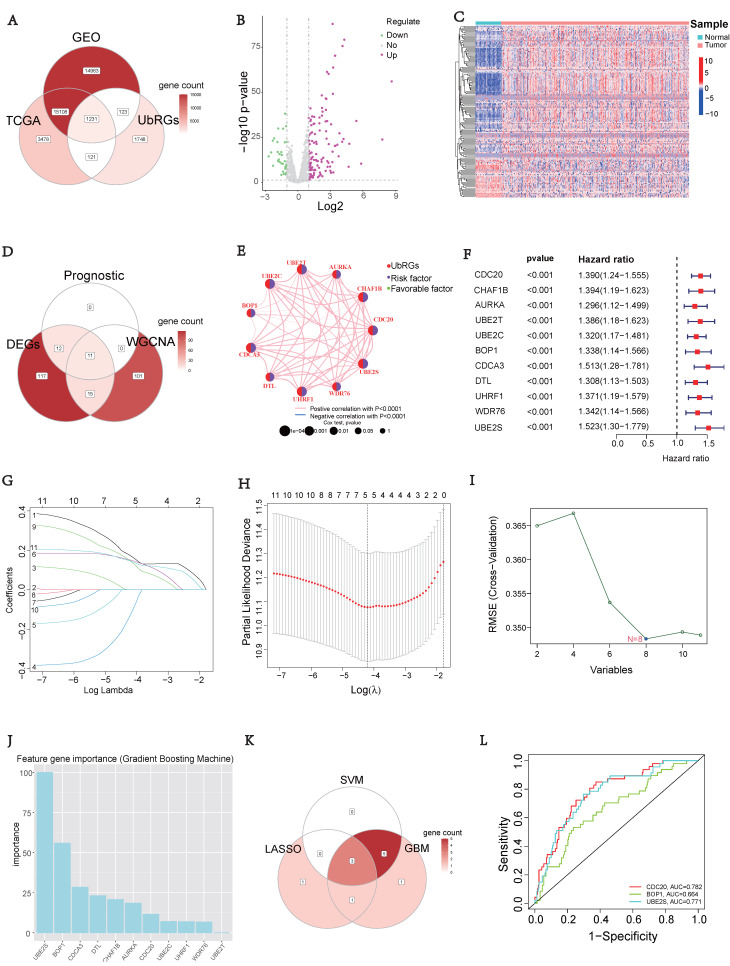
Figure 2.
Signature of Ubiquitination-Related Genes (UbRGs). (A) The Venn diagram illustrates the overlap of co-expressed genes among the TCGA, GEO, and IUUCD 2.0 databases. (B) The volcano plot visualizes the differentially expressed genes (DEGs) between tumor and normal tissue among the 1231 UbRGs. (C) The heatmap displays the expression pattern of 155 characteristic DEGs. (D) The Venn diagram illustrates the overlap of UbRGs among WGCNA, DEGs, and prognosis. (E) The network diagram visualizes the interactions among eleven genes. (F) The forest plot displays the expression of the eleven OS-related genes. (G) The distribution of coefficients in the LASSO model. (H) Selection of the five optimal parameters in the LASSO model. (I) Validation of the expression of biomarker signature genes using the SVM-RFE algorithm. (J) Importance of feature genes are determined by the gradient boosting machine (GBM) algorithm. (K) The Venn diagram illustrates the overlap of diagnostic markers extracted by the LASSO, SVM-RFE, and GBM algorithms. (L) ROC curves are plotted for CDC20, BOP1, and UBE2S.

