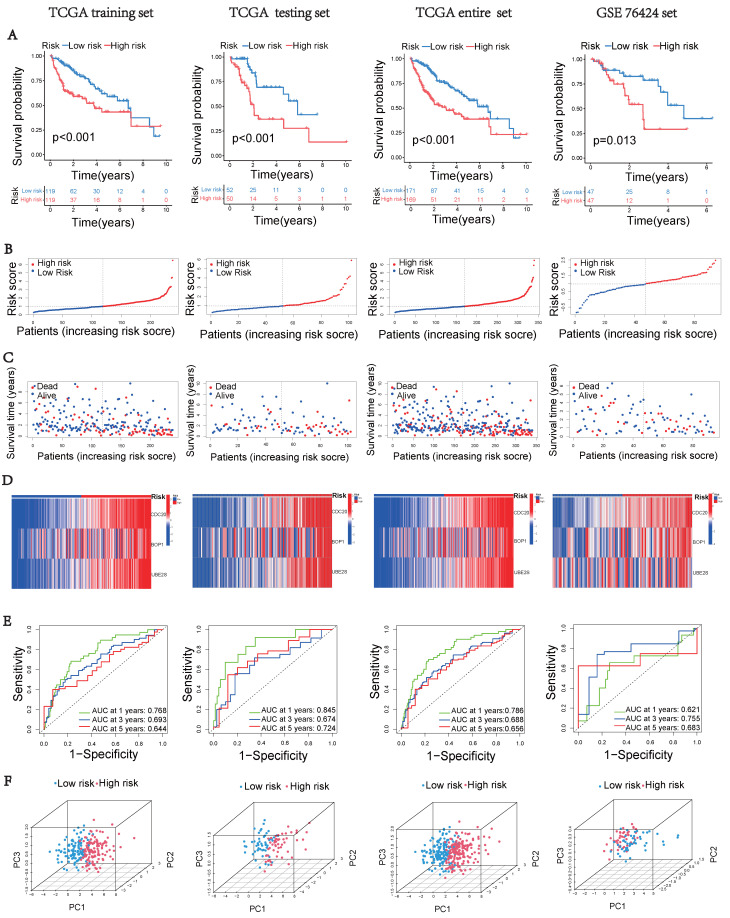
Figure 3.
Construction of the UbRGs risk score model. (A) Kaplan-Meier curves for OS based on the stratification of risk scores in different datasets. (B) Distribution of risk scores in different datasets. (C) Distribution of survival time of patients in different datasets. (D) Heatmap illustrating the expression levels of CDC20, BOP1, and UBE2S in different datasets. (E) ROC analysis for the prediction of OS at 1, 3, and 5 years in different datasets. (F) Principal component analysis of different datasets.

