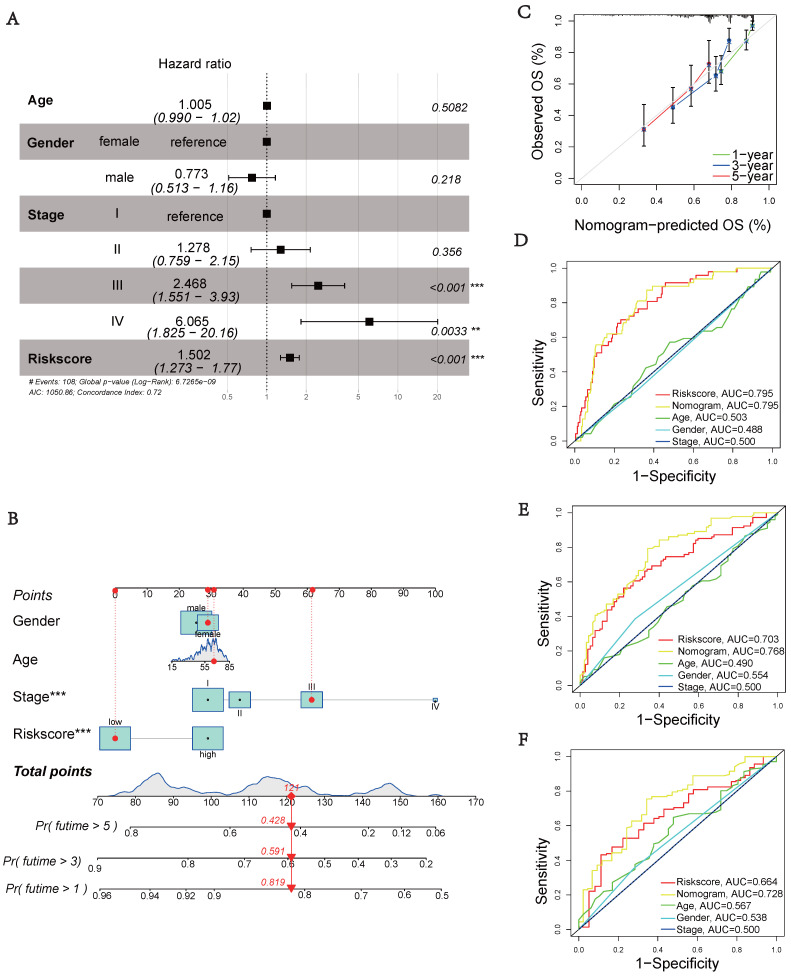
Figure 4.
Clinical validation of the prognostic model. (A) Analysis of risk score and clinicopathological features using a forest plot. P-values were calculated using Mann-Whitney U tests. (B) Nomogram for predicting OS. (C) Calibration plot of the nomogram comparing projected and observed outcomes. (D) AUC values for predicting 1-year OS. (E) AUC values for predicting 3-year OS. (F) AUC values for predicting 5-year OS.

