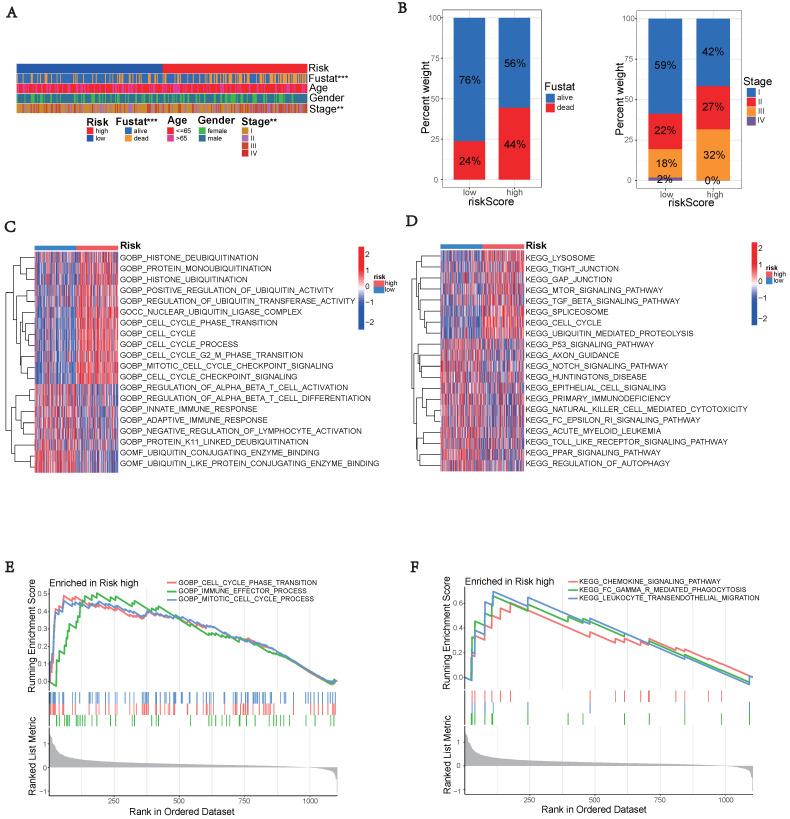
Figure 6.
Enrichment analysis of gene functions in risk groups using gene set variation analysis (GSVA) and gene set enrichment analysis (GSEA). (A) Heatmap illustrating the clinical characteristics of patients in the low-risk and high-risk groups. (B) Bar graphs depicting the distribution of different risk groups based on patient survival status and tumor stage. (C) Heatmap illustrating the activation state of GO pathways in different groups after processing using GSVA. (D) Heatmap illustrating the activation state of KEGG pathways in clustered groups after processing using GSVA. (E) Enriched GO pathways associated with DEGs in the predicted groups using GSEA. (F) Enriched KEGG pathways associated with DEGs in the predicted groups using GSEA.

