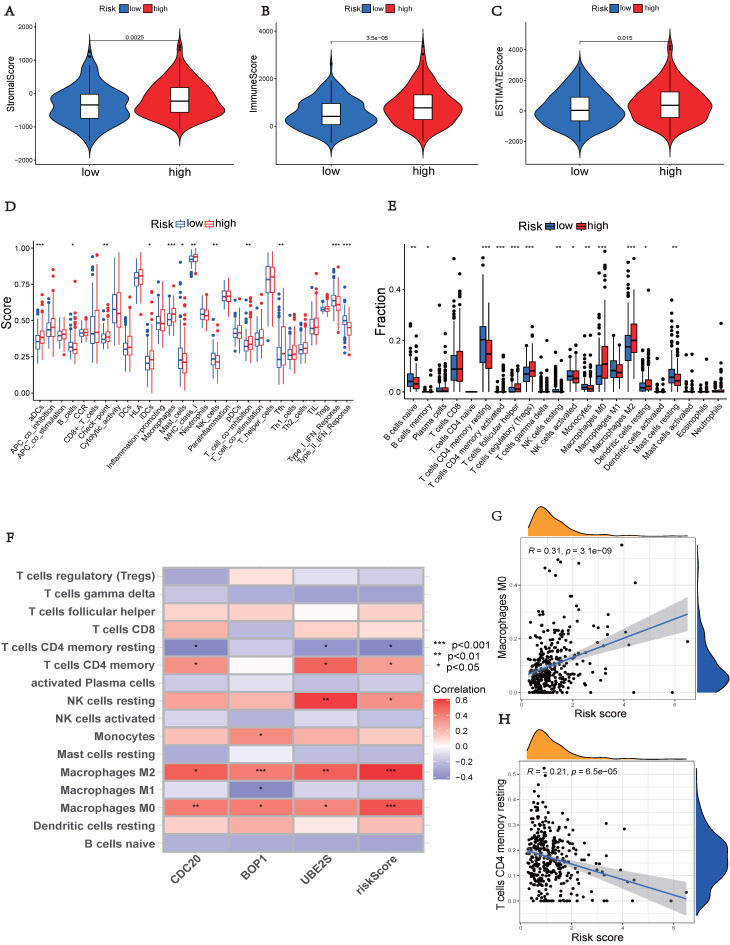
Figure 7.
Comparison of immune status between different risk groups. (A) Comparison of stromal scores. (B) Comparison of immune scores. (C) Comparison of ESTIMATE scores. (D) Comparison of immune cell enrichment scores. (E) Comparison of immune cell infiltration. (F) Correlation analysis between immune cells and UbRGs. (G) Correlation analysis between risk score and macrophages M0. (H) Correlation analysis between risk score and T cells CD4 memory resting. (*p < 0.05; **p < 0.01; ***p < 0.001).

