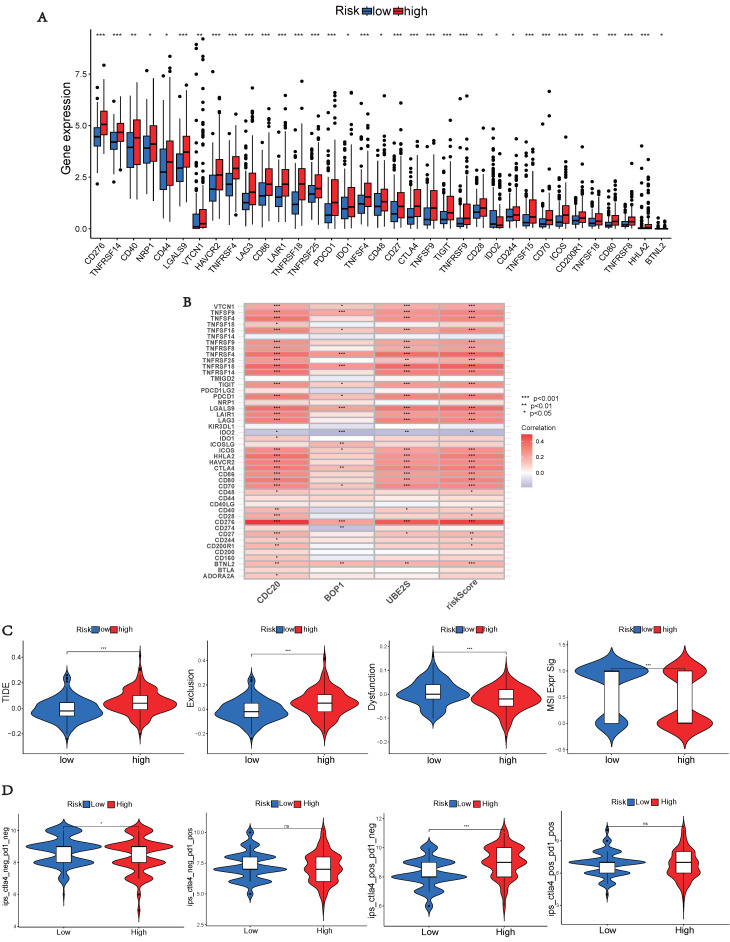
Figure 8.
Immune checkpoint analysis, TIDE and TCIA. (A) Expression of immune checkpoints in different risk groups. (B) Association between immune checkpoints and UbRGs. (C) TIDE, scores for T cell exclusion and dysfunction, and MSI in different risk groups. (D) Differences in immune checkpoint inhibitor response between the high-risk and low-risk groups. (*p < 0.05; **p < 0.01; ***p < 0.001).

