. 2024 Feb 9;6(2):e230080. doi: 10.1148/rycan.230080

Figure 4:

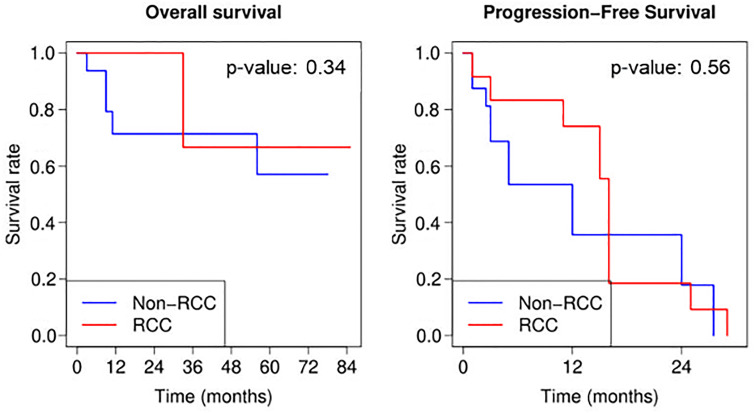
Graphs of Kaplan-Meier curves for overall survival and progression-free survival for all study patients, patients with renal cell carcinoma (RCC), and patients without RCC. Treatment day = day 0. P values are based on the log-rank test; non-RCC appears to have lower overall and progression-free survival rates early on, but the differences with RCC are not significant.

Graphs of Kaplan-Meier curves for overall survival and progression-free survival for all study patients, patients with renal cell carcinoma (RCC), and patients without RCC. Treatment day = day 0. P values are based on the log-rank test; non-RCC appears to have lower overall and progression-free survival rates early on, but the differences with RCC are not significant.