
Figure. Mean Concentrations of Blood Biomarkers During the 30 Years Before Diagnosis of Depression, Anxiety, or Stress-Related Disorders.
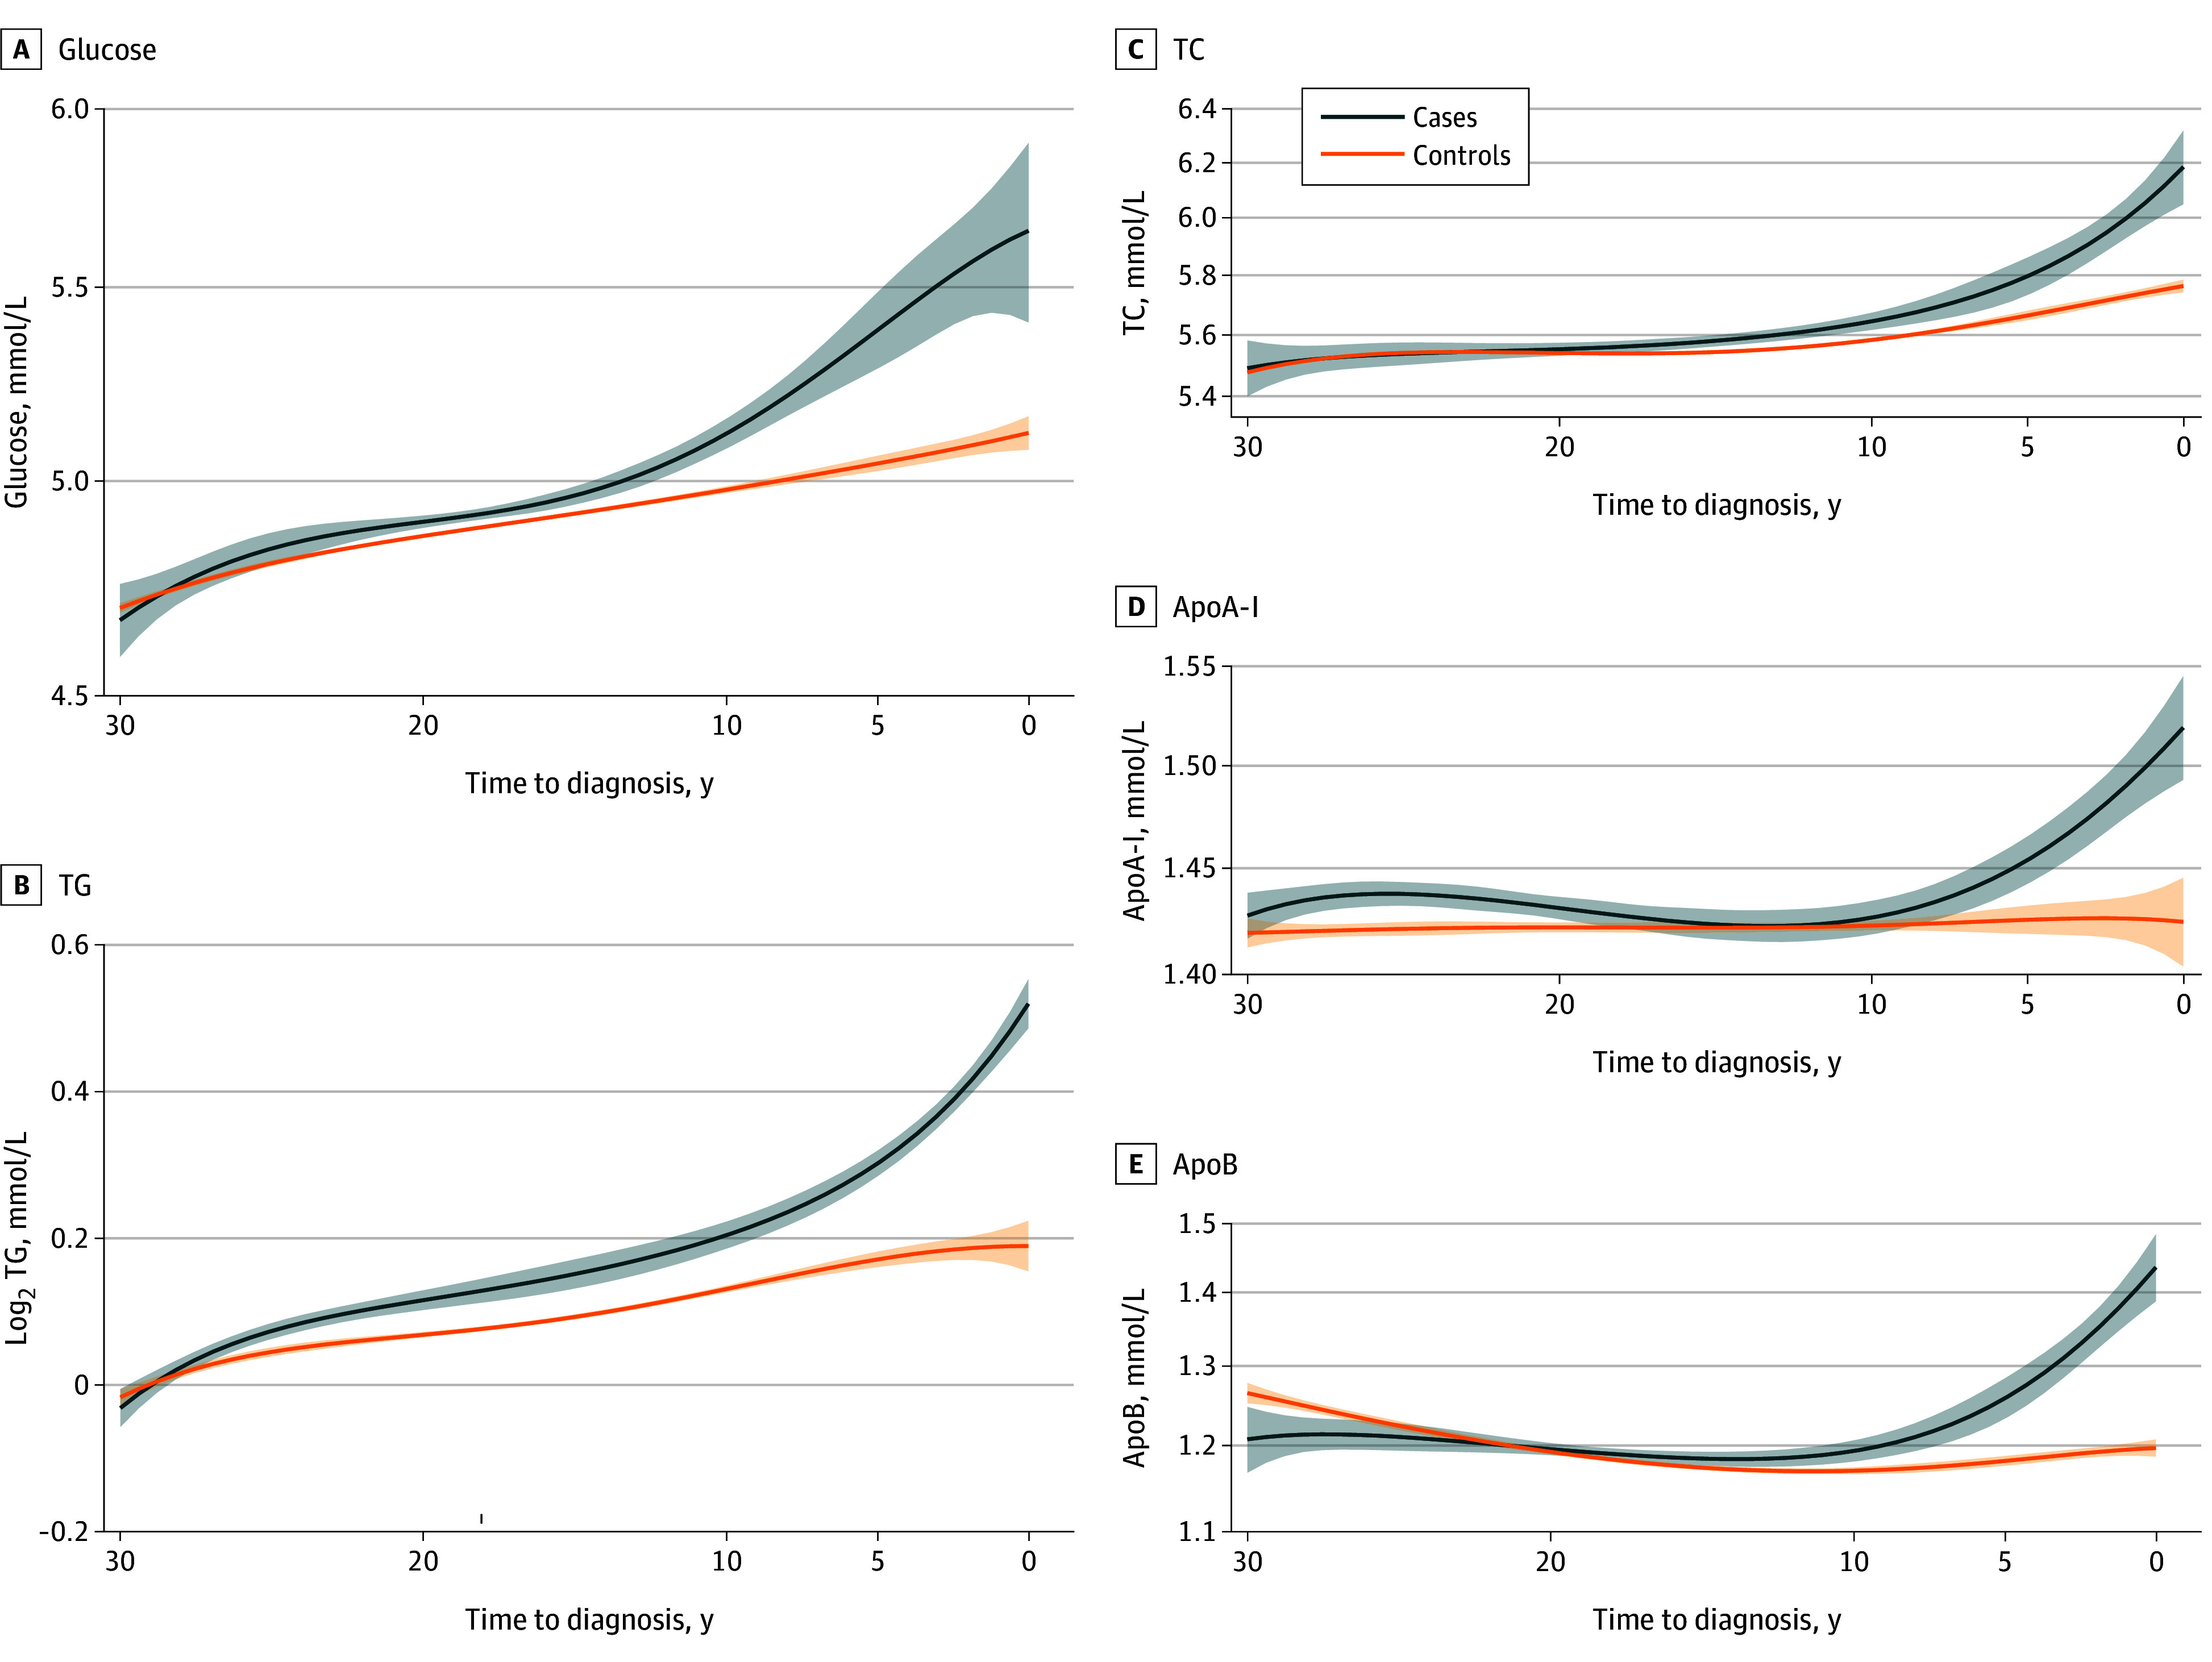
The method of local polynomial smoothing with fourth-degree polynomial function and gaussian kernel function was used to plot the mean concentrations of the biomarkers over time before the index date with 95% CIs. ApoA-I indicates apolipoprotein A-I (to convert to milligrams per deciliter, multiply by 0.01); ApoB, apolipoprotein B (to convert to milligrams per deciliter, multiply by 0.01); TC, total cholesterol (to convert to milligrams per deciliter, multiply by 0.0259); TG, triglycerides (to convert to milligrams per deciliter, multiply by 0.0113). Shaded areas represent 95% CIs.