
Figure 2.
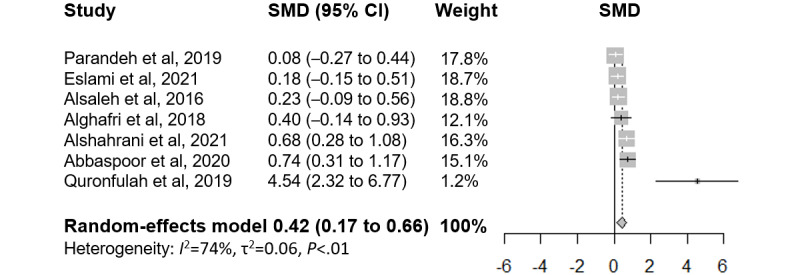
Forest plot of effect sizes and 95% CIs of physical activity outcomes ordered by descending effect size of the individual studies. SMD: standardized mean difference.
Official websites use .gov
A
.gov website belongs to an official
government organization in the United States.
Secure .gov websites use HTTPS
A lock (
) or https:// means you've safely
connected to the .gov website. Share sensitive
information only on official, secure websites.
Forest plot of effect sizes and 95% CIs of physical activity outcomes ordered by descending effect size of the individual studies. SMD: standardized mean difference.