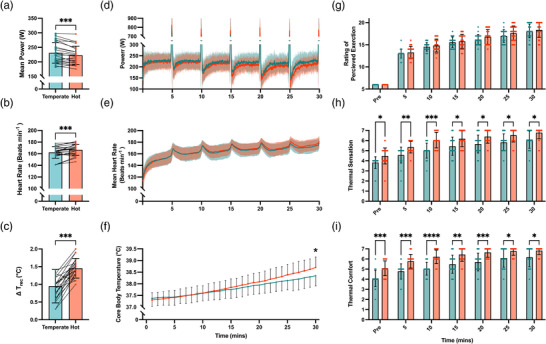
FIGURE 2.

Performance and physiological responses during the 30‐min capacity test in hot (35°C, 50% RH) and temperate (21°C, 50% RH) conditions. (a–f) Mean power output (W) (a), mean heart rate (beats min−1) (b), core temperature change from pre to post exercise (ΔT rec, °C) (c), second‐by‐second mean power output (d), heart rate (e) and minute‐by‐minute mean core temperature (°C) (f) during 30‐min capacity test. (g–i) Perceptual responses to heat stress during exercise recorded every 5 min including rating of perceived exertion (RPE) (g), thermal sensation (h), and thermal comfort (i). A significant difference is denoted by asterisks: *P < 0.05, **P < 0.01, ***P < 0.001, ****P < 0.0001.
