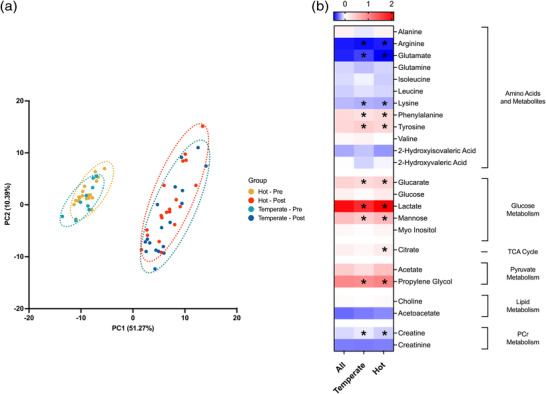
FIGURE 3.

(a) Multivariate principal component analysis (PCA) of human serum pre‐ (0 min) and post‐ (30 min) exercise in hot (35°C) and temperate (21°C) conditions. Brackets represent the variance explained by PC, with 9 PCs required to explain 95% of the variance. For clarity, only PC1 and PC2 are shown on each axis. Ellipses represent a 95% confidence region. (b) Heatmap of all identified metabolites reporting the fold change from pre‐ to post‐exercise as the natural logarithm (log2) to indicate whether each metabolite level had increased (greater than 0, red) or decreased (less than 0, blue) following exercise. ‘All’ refers to the fold change of metabolites in the dataset without stratification for environmental conditions. *Significant difference in metabolite abundance from pre‐ to post‐exercise.
