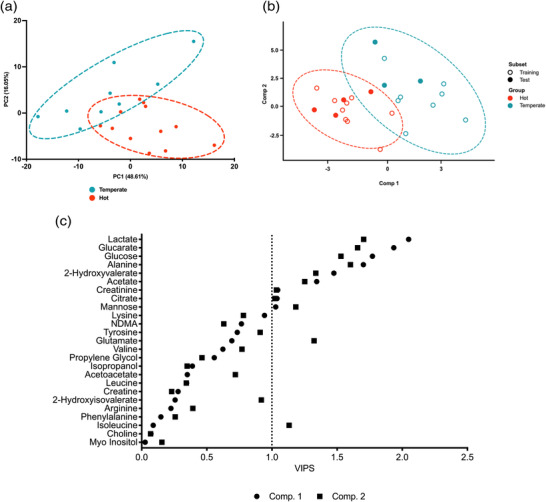
FIGURE 4.

Multivariate analysis of change in human serum metabolite concentration from pre‐ to post‐exercise in hot (35°C, 50% RH) and temperate (21°C, 50% RH) conditions. (a) Principal component analysis (PCA) between environmental conditions. Brackets represent the variance explained by PC, with eight PCs required to explain 95% of the variance. For clarity, only PC1 and PC2 are shown in each panel. Ellipses represent a 95% confidence region. (b) Partial least squares discriminant analysis (PLS‐DA) scores plots representing components 1 and 2 for change in human serum metabolite concentration discriminating between hot (35°C) and temperate (21°C) conditions. Circular data points represent samples on which the model was built (training), and triangular data points represent samples used to validate the model (test). Ellipses show the 95% confidence region. (c) VIP scores of PLS‐DA models built upon intervention‐dependent differences in human serum metabolome for components 1 and 2. Circular points represent VIP scores for metabolites in component 1, and square points represent VIP scores for component 2. The vertical dashed line represents the VIP > 1 threshold.
