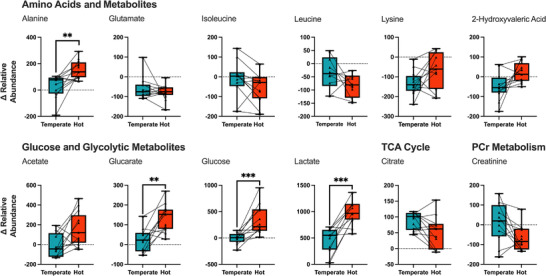
FIGURE 5.

Box‐plots representing median Δ abundance from pre to post of VIP filtered serum metabolites following exercise in hot (35°C, 50% RH) and temperate (21°C, 50% RH) conditions. A significant difference between hot and temperate conditions is denoted by asterisks: **P < 0.01, ***P < 0.001.
