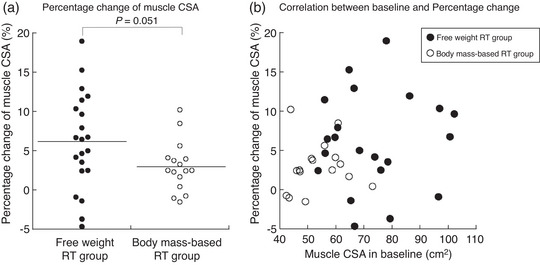
FIGURE 5.

(a) The percentage change in muscle CSA in quadriceps femoris between the free weight RT group and the body mass‐based RT group. (b) Relationship between baseline muscle CSA in quadriceps femoris and the percentage change in muscle CSA in the free weight RT group and the body mass‐based RT group. CSA, cross‐sectional area; RT, resistance training.
