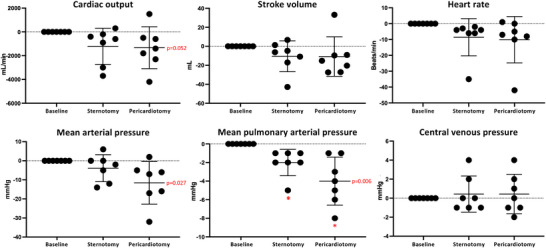
FIGURE 2.

Haemodynamic changes from sternotomy and pericardiotomy. Data are shown as absolute changes from baseline (closed chest) and presented as the mean ± SD. P‐values represent the overall ANOVAs. * P < 0.05 versus baseline in post‐hoc analysis.
