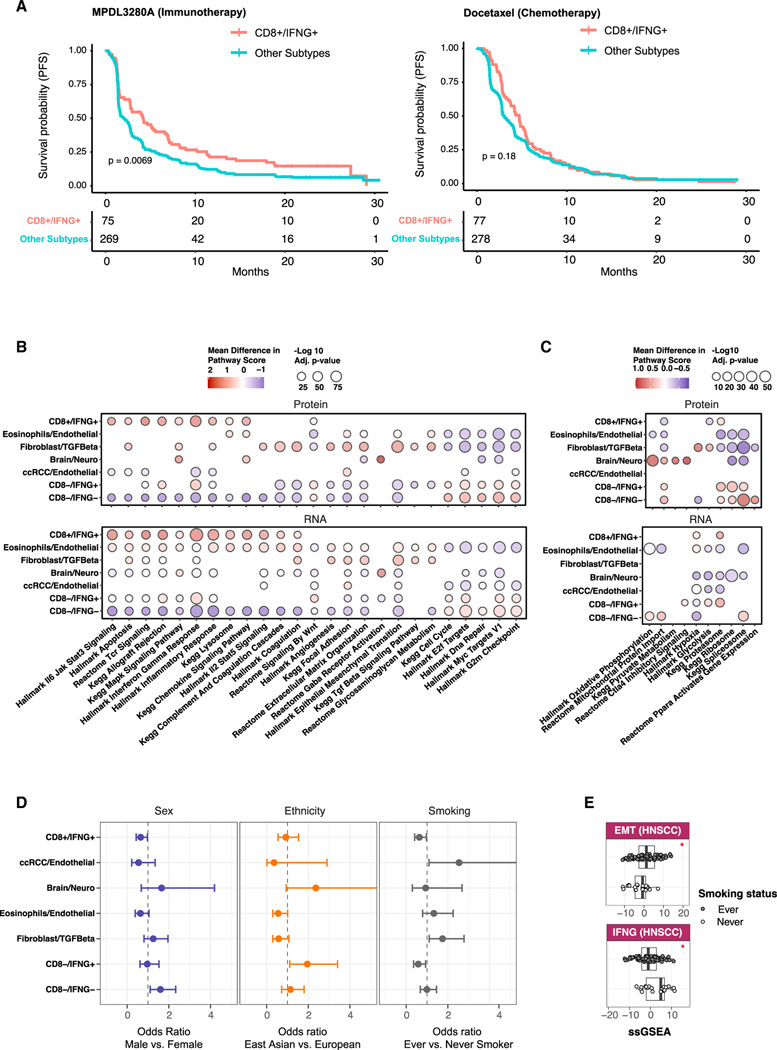
Figure 2. Associations of immune subtypes with treatment responses, pathway activities, and patient demographic variables.
.
(A) Kaplen-Meier curves displaying associations between CD8+/IFNG+ and PFS for samples in the immunotherapy (left) and chemotherapy (right) arms in the phase III OAK clinical trial.30 p values from logrank test are reported.
(B) Bubble plot showing summary statistics of association analyses between immune subtypes and biological pathways. Bubble sizes correspond to Benjamini-Hochberg adjusted p values (−log10 scale), while bubble colors correspond to the mean differences between the averaged pathway score for samples in one immune subtype and that of the other subtypes.
(C) Bubble plot showing pathway analysis results as in (B), but for pathways found activated solely based on proteomics.
(D) Pan-cancer association between immune subtypes and demographic variables. Error bars correspond to 95% confidence intervals of odds ratios.
(E) Boxplots for pathway scores of Epithelial Mesenchymal Transition (EMT) and Interferon Gamma Signaling (IFNG) pathways among HNSCC cancers stratified by smoking status. (*) indicates significant p values (< 0.05) based on the Wilcoxon signed rank test.

