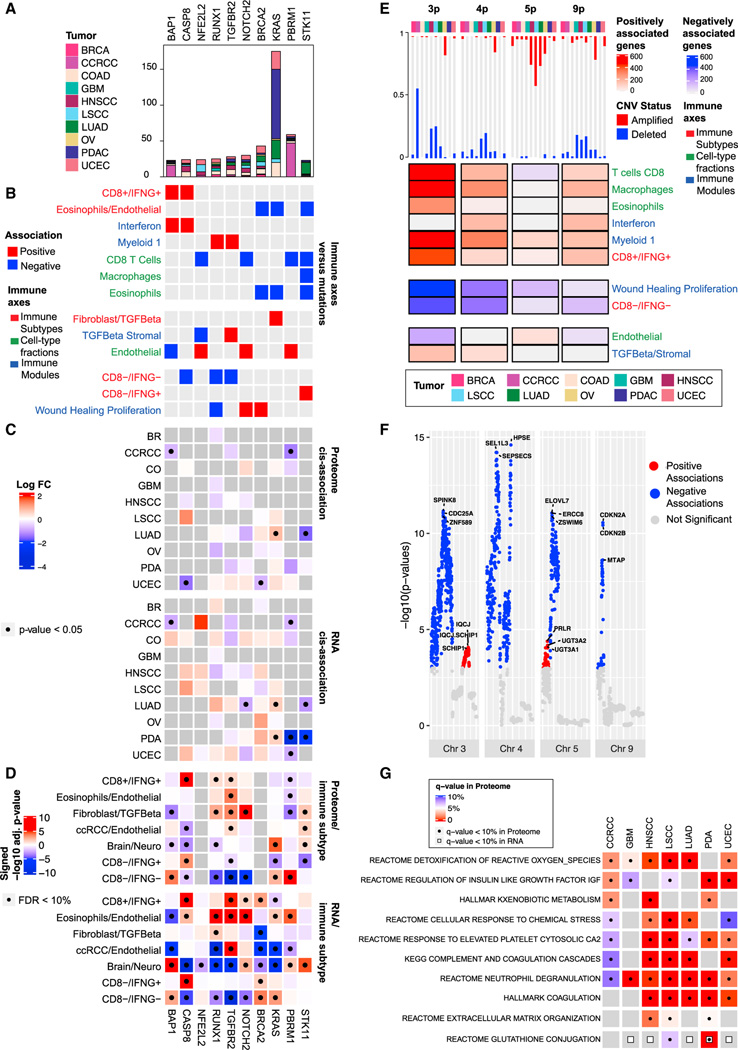
Figure 3. Association of immune subtypes with DNA alterations$$PARABREAKHERE$$(A) Bar plot showing the total number of mutations per gene stratified by cancer.
(B) Pan-cancer association between mutation profiles and immune traits based on elastic-net regressions. Red and blue entries correspond to positive and negative coefficients in the regression model, respectively.
(C) Heatmaps showing, for each gene, the association between its mutation status and its RNA/protein expressions in each cancer. Colors in the heatmap correspond to log fold-change (log FC) of the expressions between mutant and wild-type samples. Significant associations (p value from two-sided Mann-Whitney U test < 0.05) are labeled with black dots.
(D) Heatmaps showing the association between protein/RNA expression and immune subtype. Colors in the heatmap represent signed −log10 Benjamini-Hochberg adjusted p values. Significant associations (adjusted p value < 10%) are labeled with black dots.
(E) Heatmap displaying pan-cancer association between CNV and immune traits. For each cancer, the bar plot on the top shows the proportion of samples with more than 50% of the genes depleted (blue) or amplified (red) in the corresponding chromosome region. The heatmap shows, for each chromosome, the number of genes whose copy-number values were positively or negatively associated with the immune axes, represented in red and blue, respectively.
(F) Manhattan plot summarizing the pan-cancer association between gene-level CNV data and the Wound Healing Proliferation module for selected chromosomes. The y axis shows −log10 p value from linear regression.
(G) Heatmap displaying, for each cancer, the pathways over-represented in the set of pProteins and eGenes. Significant enrichments at 10% FDR are displayed with a black dot for pProteins and a white square for eGenes.

