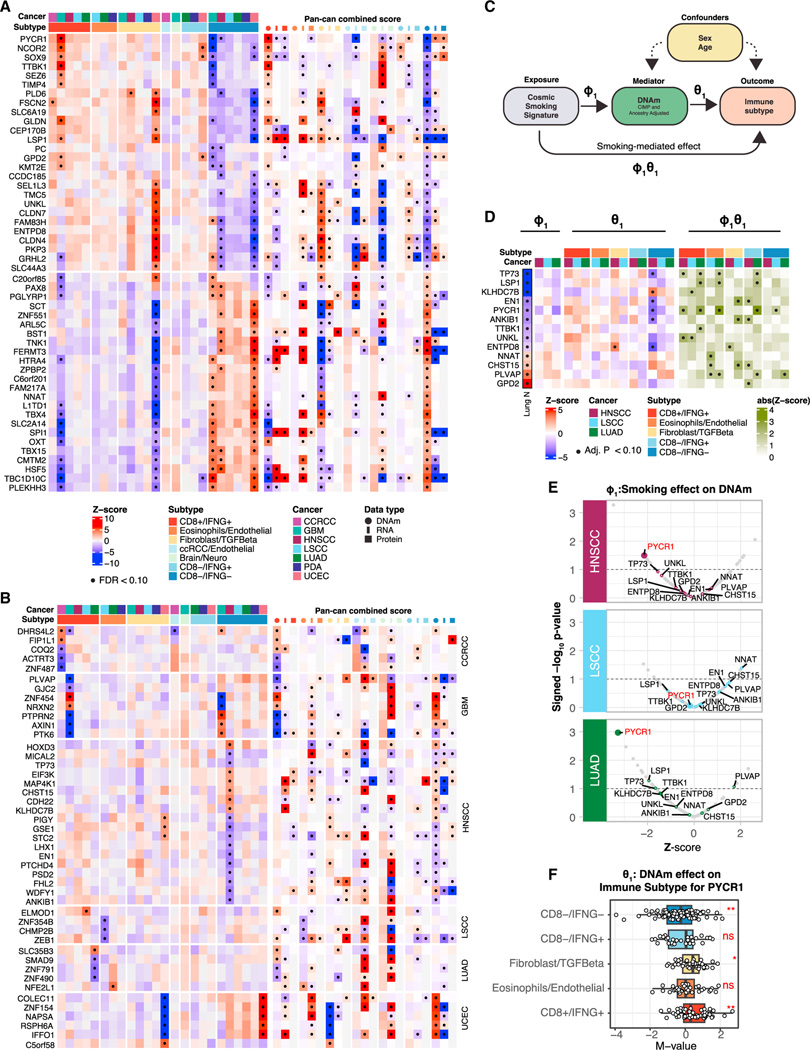
Figure 4. Association of immune subtypes with DNA methylations.
(A) Heatmap illustrating DNAm associations with immune subtypes for a set of genes exhibiting significant associations in at least two cancers or in the pan-cancer analysis (STAR Methods). The color gradients represent the average (standardized) DNAm levels within tumors from each immune subtype stratified by cancers (left) or the average Z scores across tumors in each immune subtype across all cancers (right) for different omics (DNAm, RNA, and proteins). Significant associations (FDR < 10%) are labeled with black dots.
(B) Heatmap illustrating DNAm associations with immune subtypes as in (A) for the topmost significant genes whose DNAm was associated with immune subtypes in only one cancer (FDR < 10%).
(C) Diagram of the mediation analysis.
(D) Heatmap illustrating three association analyses for each gene in each cancer: COSMIC smoking signature vs. DNAm (left), DNAm vs. immune subtype (middle), and smoking-mediated DNAm vs. immune subtype (right) for a subset of genes with significant mediation effects. In addition, the Lung N column summarizes DNAm-smoking associations as reported by a previous study on normal human lung tissues.49 The genes shown in this panel were selected based on consistent association trends between DNAm and smoking in LUAD and in normal lung tissues (Lung N). Significant associations (FDR < 10%) are labeled with black dots.
(E) Volcano plots summarizing the association strengths in terms of Z scores (x axis) and signed p value (−log10 scale) (y axis) between DNAm and COSMIC
smoking signatures for the subset of genes considered in the mediation analysis.
(F) Boxplots showing the distributions of DNAm levels of PYCR1 across immune subtypes, considering the union of HNSCC, LUAD, and LSCC samples. p values from ANOVA test are reported (**p value <0.01; *p value < 0.05, ns, not significant).

