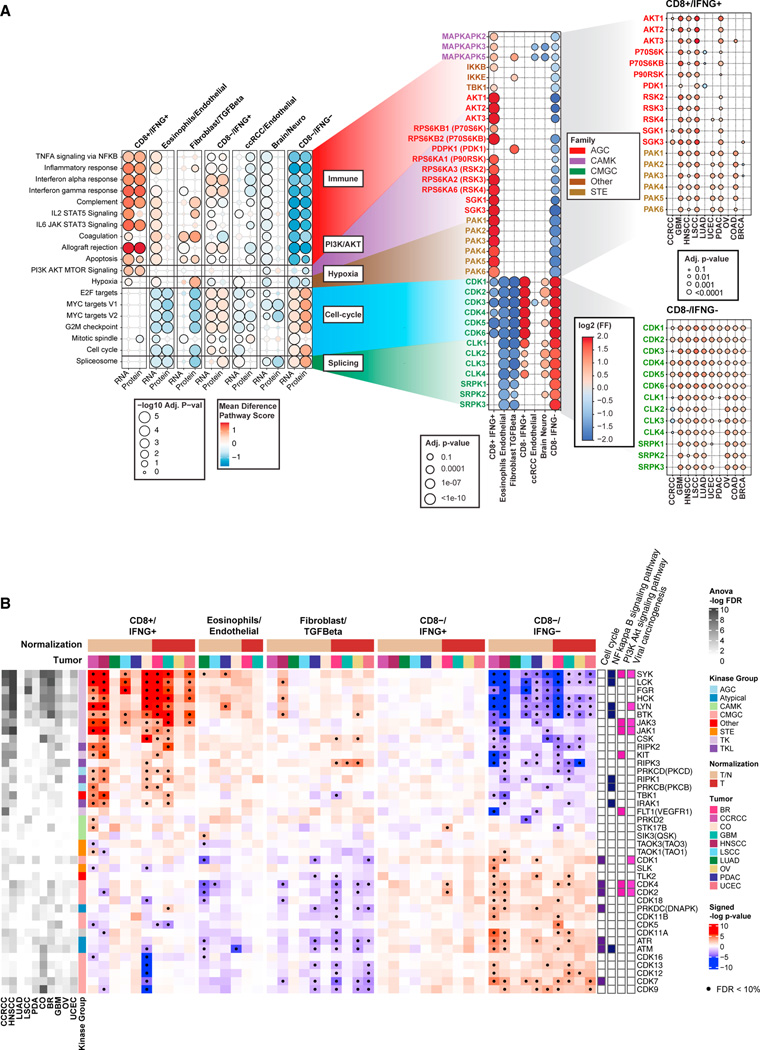
Figure 5. Associations of immune subtypes with kinases activities.
Kinases are reported as gene symbols followed by protein symbols in parenthesis.
(A) Left: bubble plot showing pathways associated with different immune subtypes based on RNA-seq and proteomics. Bubble color represents the differential mean of pathway score in each subtype compared with all other subtypes, while the bubble size illustrates the Benjamini-Hochberg adjusted p value (−log10 scale).
Middle: for each pathway, the plots show kinases whose activation was found differential across immune subtype at the pan-cancer level (adjusted p value < 10%) via the Kinase Library. The color of the bubble corresponds to the log2 frequency factor from the contingency table (log2 frequency factors [FF]), while the size of the bubble to the adjusted p value. Right: for some key kinases, the cancer-specific activation in CD8+/IFNG+ and CD8−/IFNG− are shown using similar bubble plot.
(B) Heatmap showing the associations between KEA3-based kinase activity and immune subtypes in each cancer for selected kinases. Significant associations (adjusted p value < 10%) are highlighted with a black dot. The columns on the left illustrate the overall associations between each kinase and immune subtypes from ANOVA test for each cancer. The columns on the right show the membership of kinases in immune-related pathways. The annotation track on the top illustrates whether adjacent normal tissue was considered for normalization (T/N) or not (T) when deriving KEA3 scores for each cancer.

