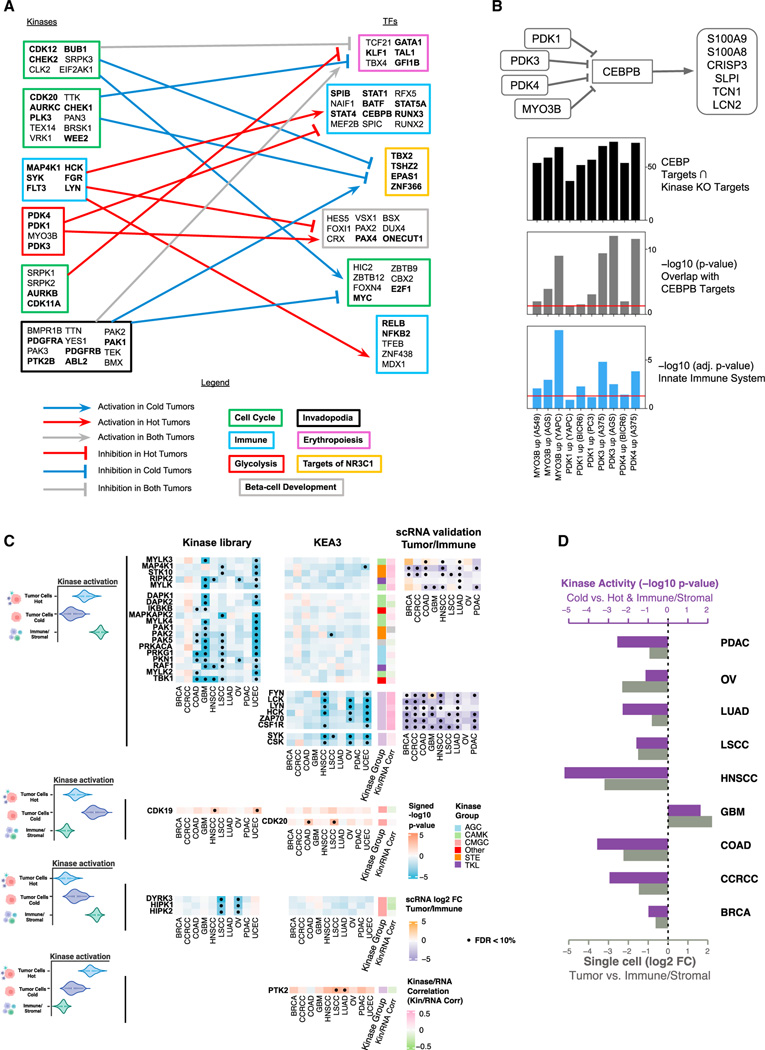
Figure 6. Kinase-TF regulation and cell-type-specific kinase activation.
(A) Kinase-TF modules from the top 1% scored kinase-TF pairs for hot and cold tumors. Arrowheads are assigned to consistent up- and down-regulations, and plungers to different signs of associations between kinases and TFs. Each module was labeled according to the most relevant pathway identified by Enrichr. Genes contained in the pathway are highlighted in bold.
(B) The diagram at the top depicts the proposed mechanism. The top bar plot (black) displays the number of genes overlapping between the sets of upregulated genes following each kinase CRISPR-Cas knockout and the experimentally determined targets of CEBPB from ENCODE ChIP-seq (STAR Methods). The middle bar plot (gray) shows the p values from Fisher’s exact test for testing whether the overlapping gene sets are significantly larger than what would occur by random chance. The bottom bar plot (blue) illustrates the enrichment of the kinase perturbation L1000 signatures for the Innate Immune System R-HSA-168249 Reactome pathway. The red lines indicate the level of 0.05. Cell line names are listed in parentheses, and their primary disease associations are: A549: lung cancer, AGS: gastric cancer, YAPC: pancreatic cancer, BICR6: head and neck cancer, A375: skin cancer.
(C) Cell-type-specific kinase activation via KEA3 and the Kinase Library. The color of the heatmap represents the signed p value (−log10 scale) from enrichment analysis. Red color represents activation in tumor cells; while blue color represents activation in immune/stromal cells. For kinases with a Pearson’s correlation between activity score and RNA expression higher than 0.2, we show the log2 fold-change (log2 FC) of gene expression between tumor cells and immune/stromal cells based on scRNA (right side). Significant associations (FDR < 10%) are displayed with a black dot. From top to bottom, we present deactivation in cold tumor cells, activation in cold tumor cells, deactivation in hot tumor cells, and activation in hot tumor cells.
(D) Differential kinase activity changes of FYN between different cell types (purple bars) and fold-changes of FYN gene expression between tumor cells and immune/stromal cells based on scRNA (light gray bars). The differential kinase activity results are displayed as signed p values (−log10 scale).

