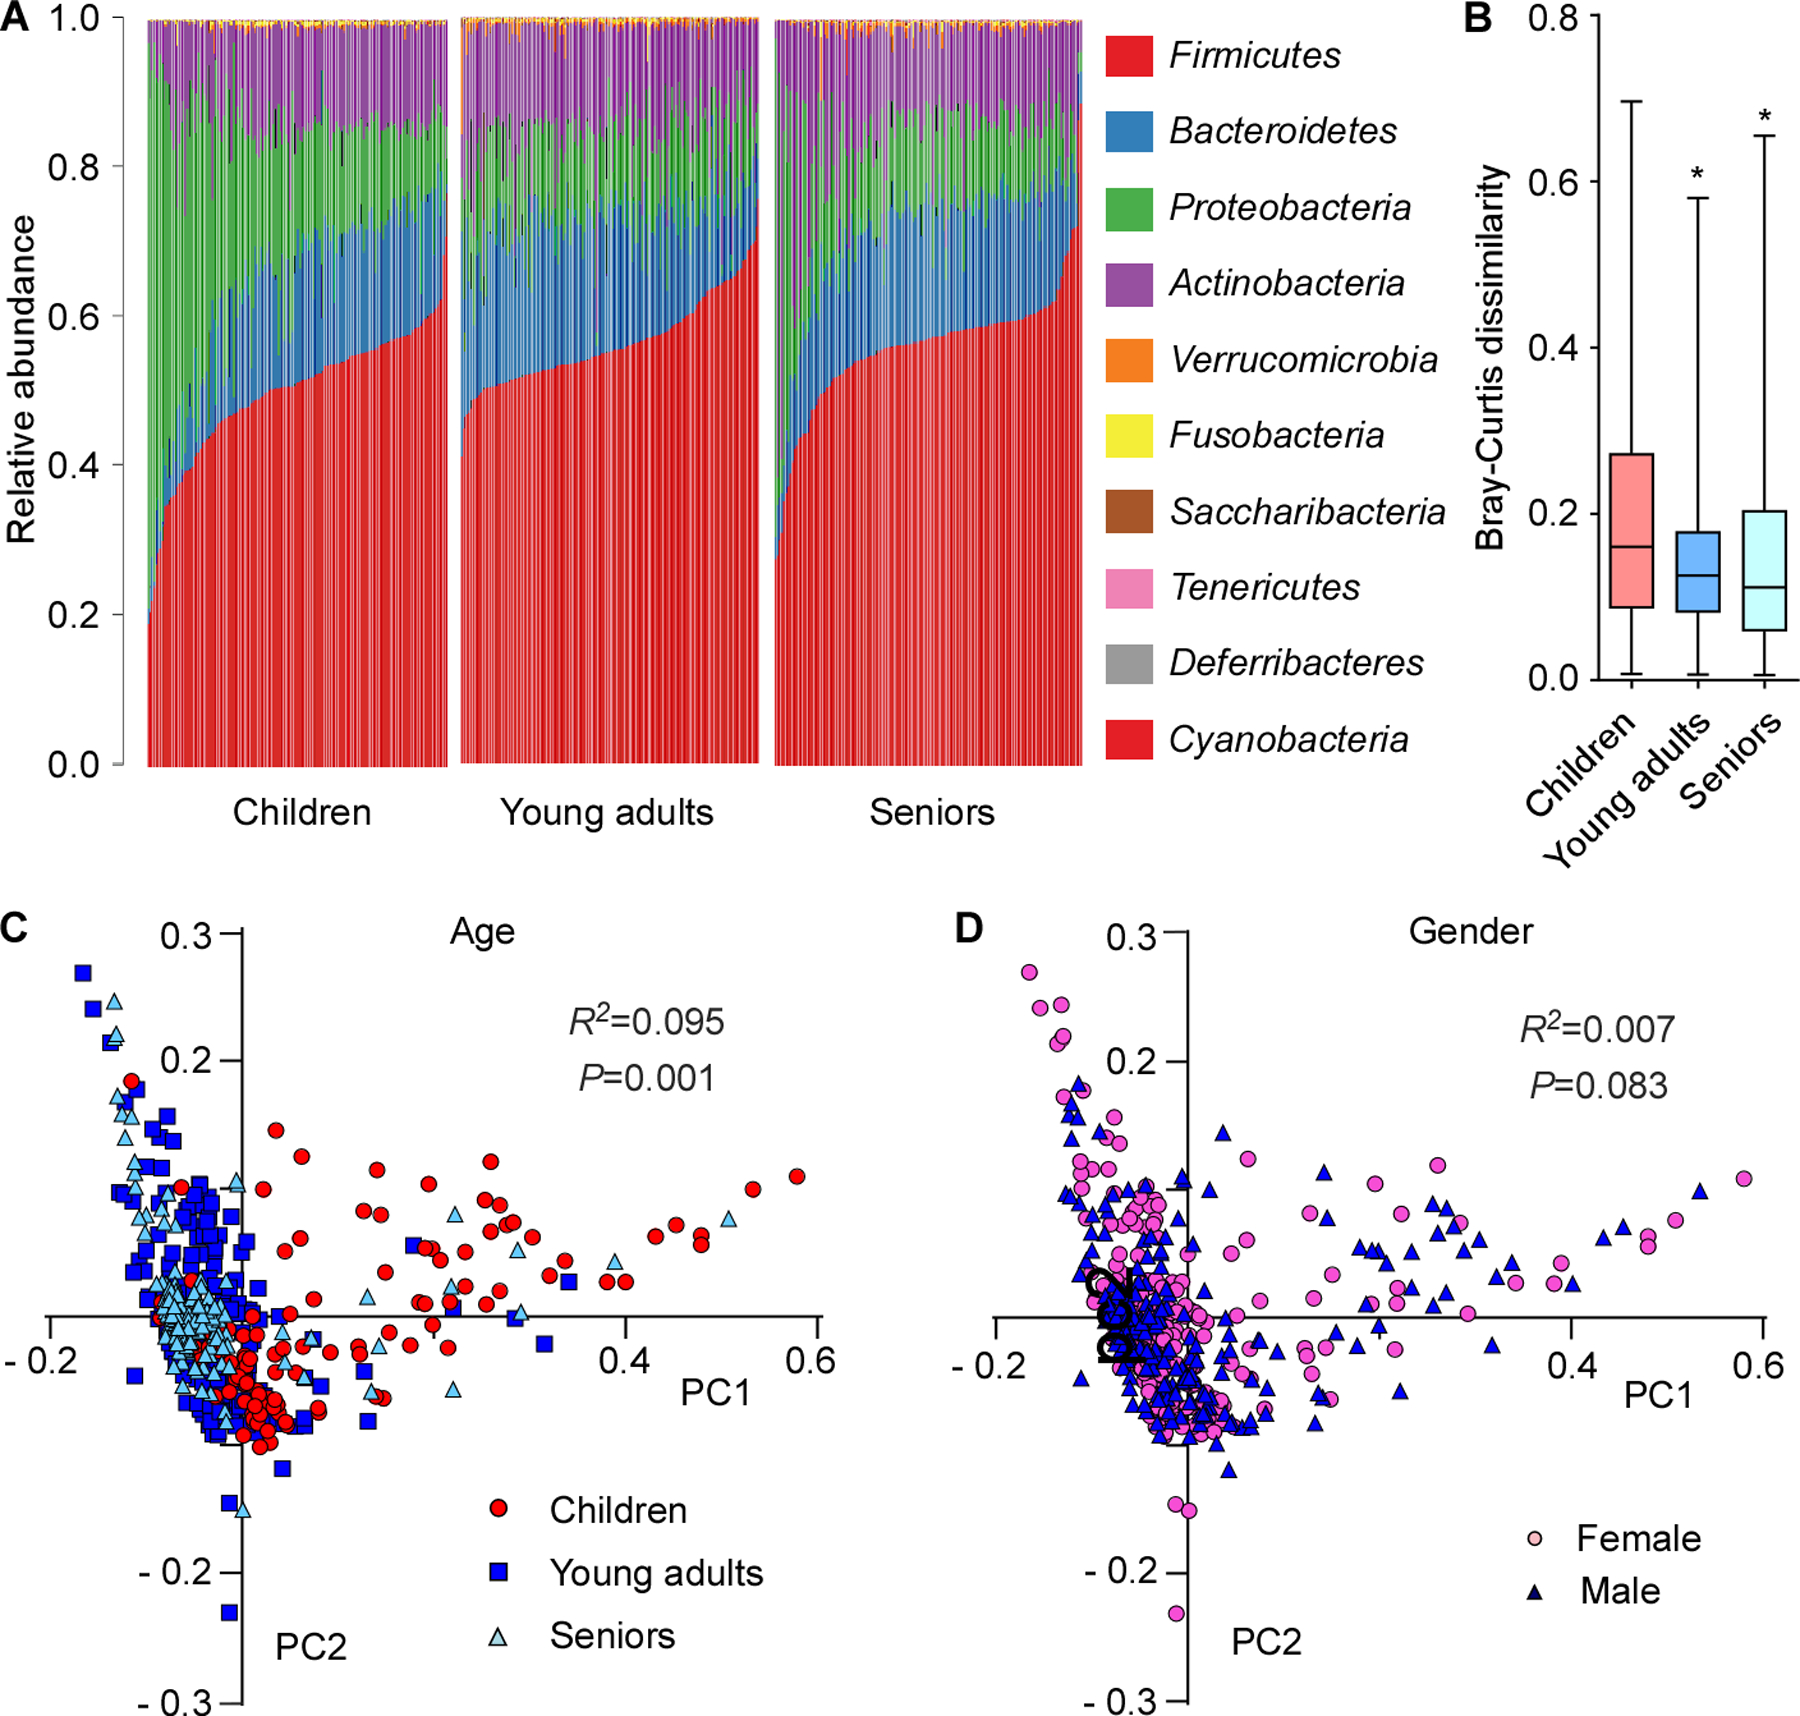
Figure 1. Development of the human nasal microbiome with age.

(A) Relative abundance of the ten major phyla in investigated individuals by age group. (B) Bray-Curtis dissimilarity of the age groups (phylum level). Statistical analysis is by 1-way ANOVA and Tukey’s post-test. *, P<0.0001. Whisker boxes are drawn from the first to third quartiles. Error bars show minima and maxima. (C) Principal coordinate analysis by age group. (D) Principal coordinate analysis by gender. (C,D) Statistical analysis is by Analysis of Similarities (ANOSIM) test.
