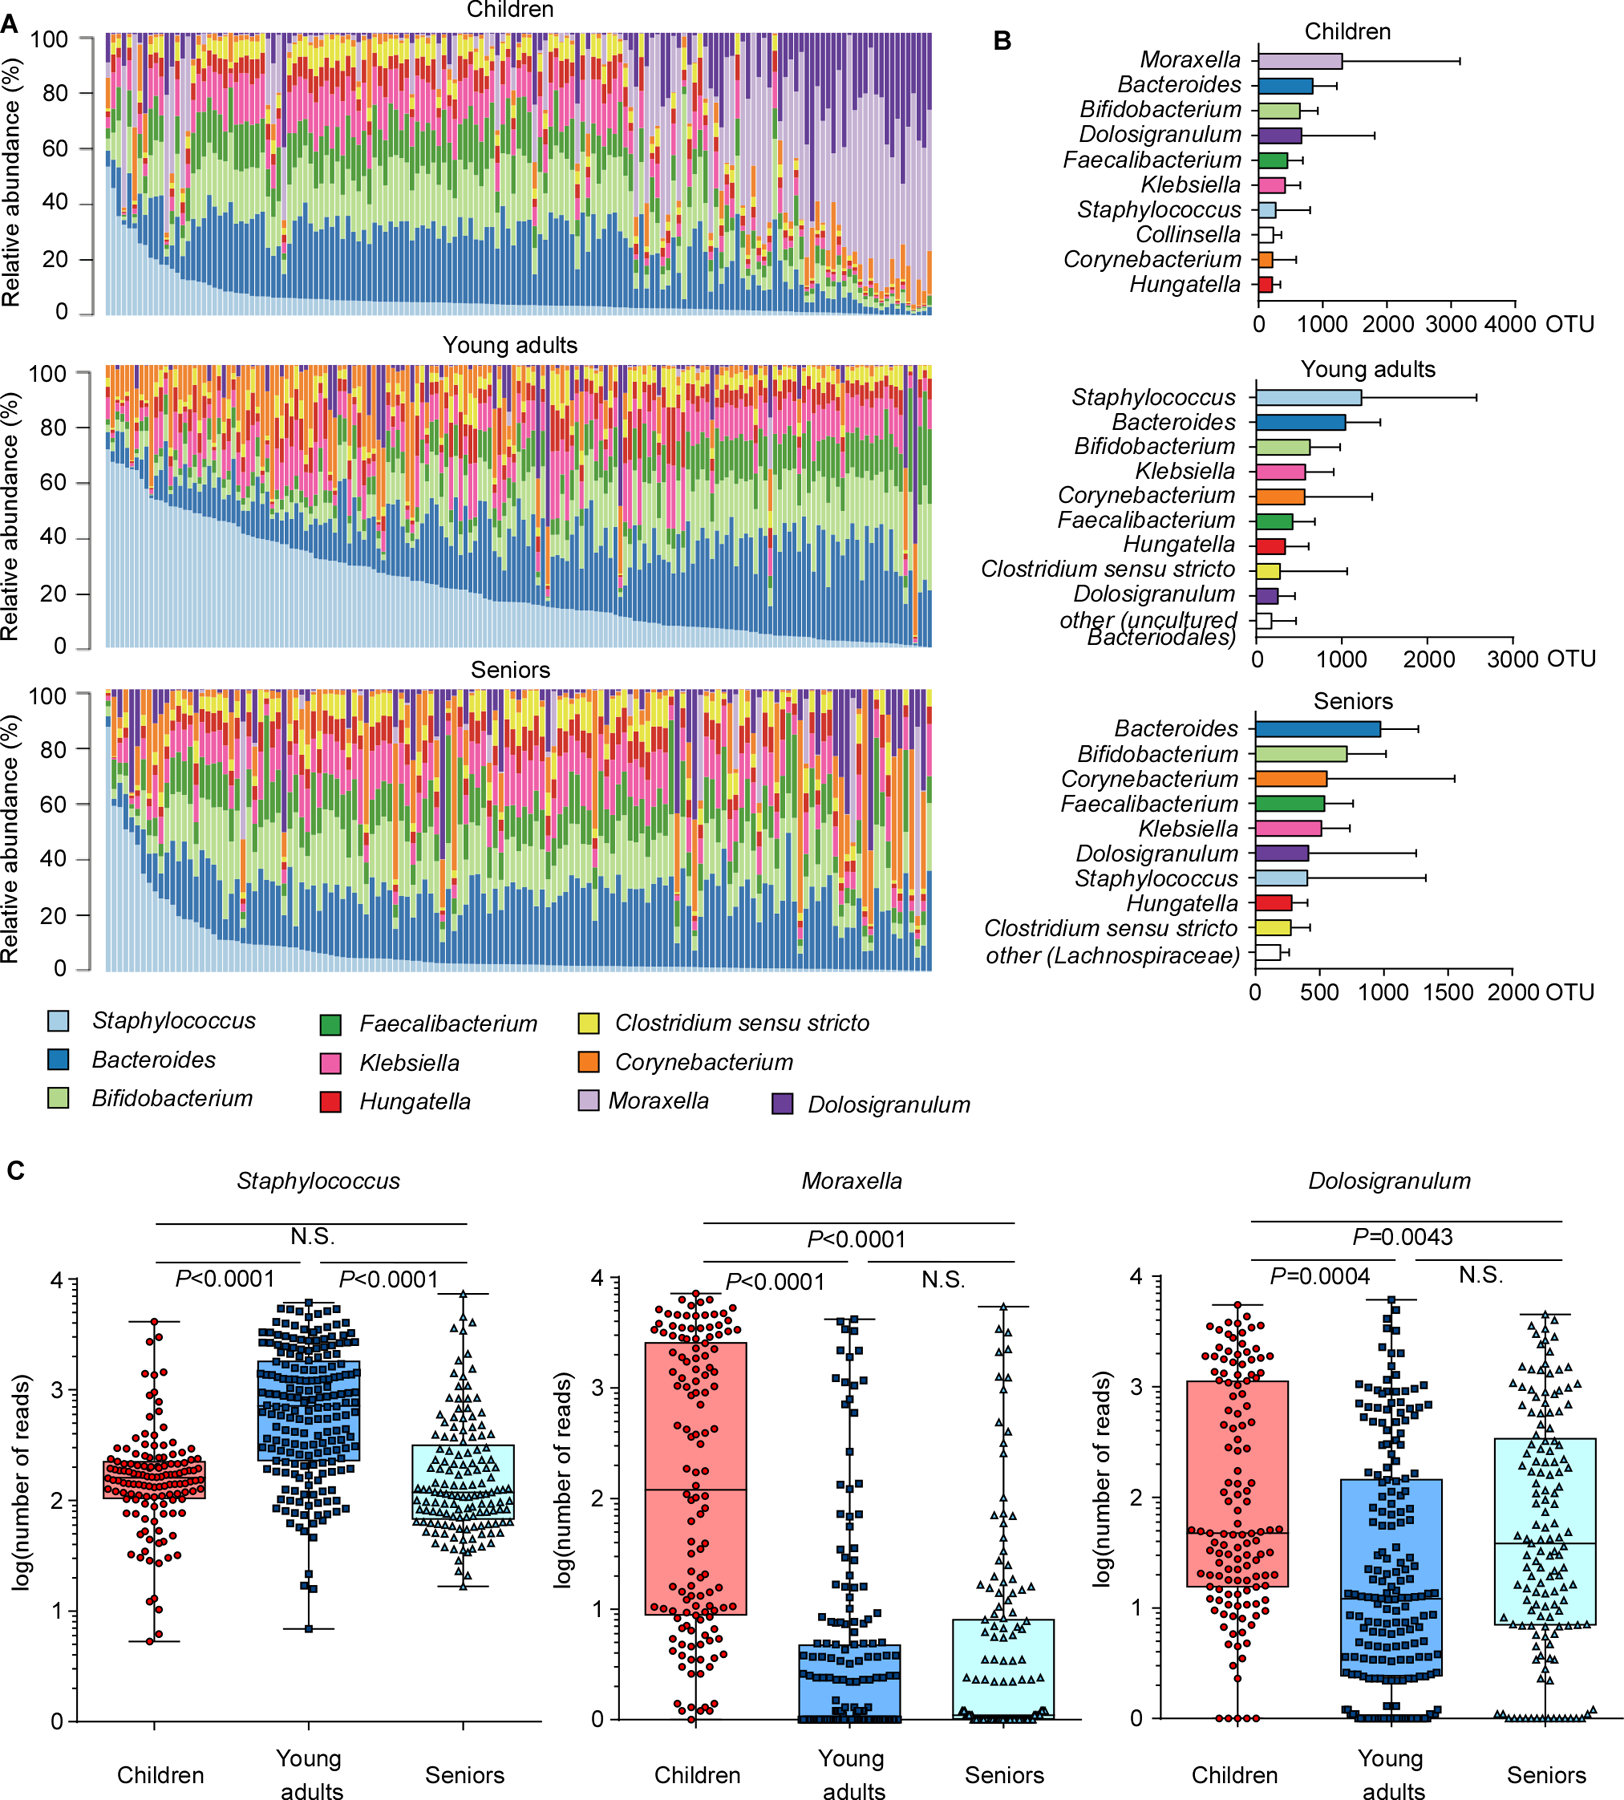
Figure 2. Correlation of abundance of Staphylococcus and other genera in the nasal microbiome.

(A) Relative abundance of major genera in the nasal microbiome of single individuals in the three analyzed age groups. (B) Abundance of major genera in the three age groups. Bars depict means; error bars SD. (C) Abundance of Staphylococcus, Moraxella, and Dolosigranulum in the three age groups, in single individuals. See Fig. S1 for other main genera. Whisker boxes are drawn from the first to third quartiles. Error bars show minima and maxima. Statistical evaluation is by 1-way ANOVA with Tukey’s post-test. Data were also analyzed by ANCOM, by which all three genera showed significant differences between groups (no post tests are available with this analysis; see Supplemental Data Set 2 for ANCOM results). The difference in the abundance of each OTU across different samples or groups was compared based on the subset of 10,000 random reads for each sample.
