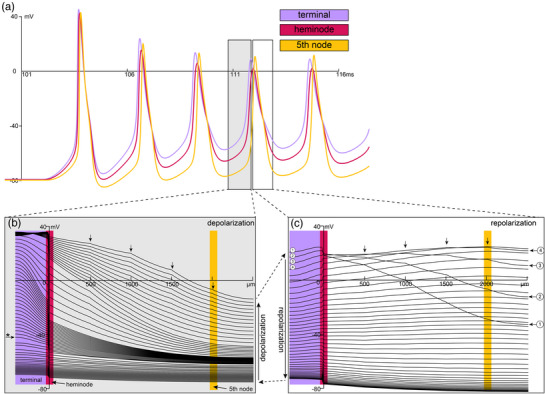
FIGURE 4.

Spike generation in Ia muscle spindles. (a) Voltage versus time outputs for the first five action potentials (AP) as the model responds to physiological ramp–hold–release stimuli (identical to all other simulations: see Figure 1). Three traces are colour‐coded to indicate key spatial domains in the generative model: Ia terminals, heminode, and fifth node of Ranvier. (b, c) plots of the voltage over the entire length of the model for the fourth AP. Grey (b) and white (c) insets show the depolarization and repolarization by space of their corresponding time courses shown in (a). Each line indicates a single snapshot in time as the model determines the voltage as it solves the joint system of differential equations governing the constellation of channel kinetics. (b) starting from the bottom left and moving up, the wave of depolarization reaches threshold, that is, AP is initiated in the Ia terminals as indicated by the inflected voltage trajectory (* horizontal arrow) and transition to steep voltage versus space relationship. The AP reaches maximum depolarization by the top trace. (c) rapid reversal of Ia terminal AP as shown in the first four traces (numbered). AP propagation initially to the heminode followed by a rapid depolarization then repolarization through the remaining nodes of Ranvier (four vertical arrows).
