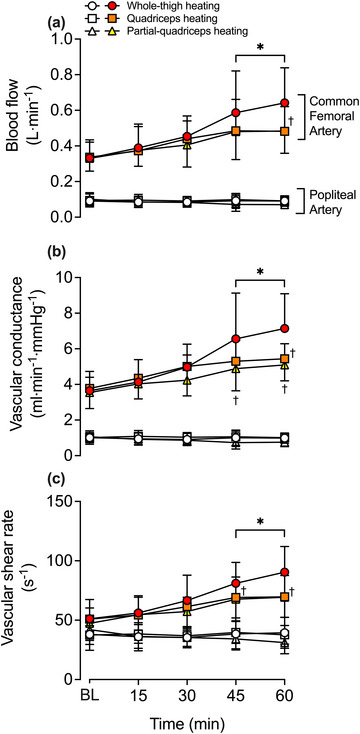
FIGURE 3.

Blood flow (a), vascular conductance (b) and shear rate (c) during whole‐thigh, quadriceps and partial‐quadriceps hyperthermia. Data represented as means ± SD (n = 11) for the common femoral (CFA) and popliteal (POA) arteries, represented by filled and open symbols, respectively. BL signifies baseline measurements. *Different from baseline across time within the same protocol, P < 0.05. †Different from whole‐thigh heating.
