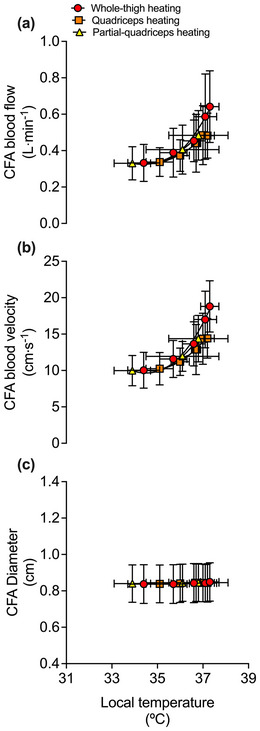
FIGURE 5.

Relationship between the mean local tissue temperature and common femoral artery (CFA) blood flow (a), blood velocity (b) and arterial diameter (c) during whole‐thigh, quadriceps and partial‐quadriceps hyperthermia. Local temperature signifies the corresponding average heated tissue temperature for the protocol, as discussed in the methods – that is, , and . Data represented as means ± SD (n = 11). Vertical error bars signify blood flow SD, while horizontal error bars signify local temperature SD. Lines represent the exponential fit of the data.
