
FIGURE 2.
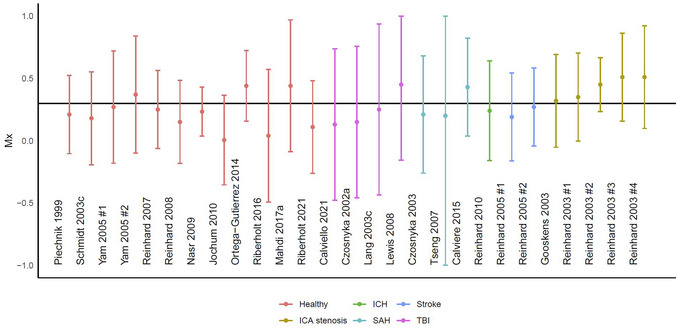
An overview of previous studies stratified by study and diagnosis (colour) (Calviello et al., 2021; Calviere et al., 2015; Czosnyka et al., 2002, 2003; Gooskens et al., 2003; Jochum et al., 2010; Lang et al., 2003c; Lewis et al., 2008; Mahdi, Nikolic, Birch, Olufsen et al., 2017; Nasr et al., 2009; Ortega‐Gutierrez et al., 2014; Piechnik et al., 1999; Reinhard et al., 2003, 2005, 2007, Reinhard, Waldkircher et al., 2008, 2010; Riberholt et al., 2016, 2021; Schmidt et al., 2003; Tseng et al., 2007; Yam et al., 2005). The data are presented as mean (95% CI); the black horizontal line depicts the conventional threshold between intact and impaired cerebral autoregulation of 0.3. For the studies with multiple presented values the first, the left, the baseline, or the ipsilateral is chosen. ICH: Intracerebral haemorrhage; ICA: internal carotid artery; SAH: subarachnoid haemorrhage; TBI: traumatic brain injury.