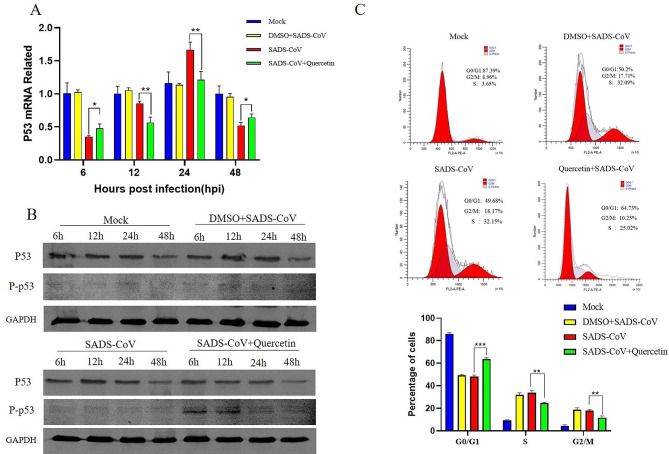
Fig. 4.
Quercetin regulation of P53 as well as cell cycle induced by SADS-CoV infection (A) Cell lysates were collected at different time points and total RNA was extracted, and the P53 gene mRNA profile was detected using RT-qPCR. (B) Effects of SADS-CoV and quercetin on P53 protein levels and phosphorylation levels. (C) Cells were collected to analyze cell cycle distribution by flow cytometry. Results are from one of three independent experiments (n = 3), and asterisks in the graphs indicate significant differences (*P < 0.05; **P < 0.01; ***P < 0.001; ns: not significant)

