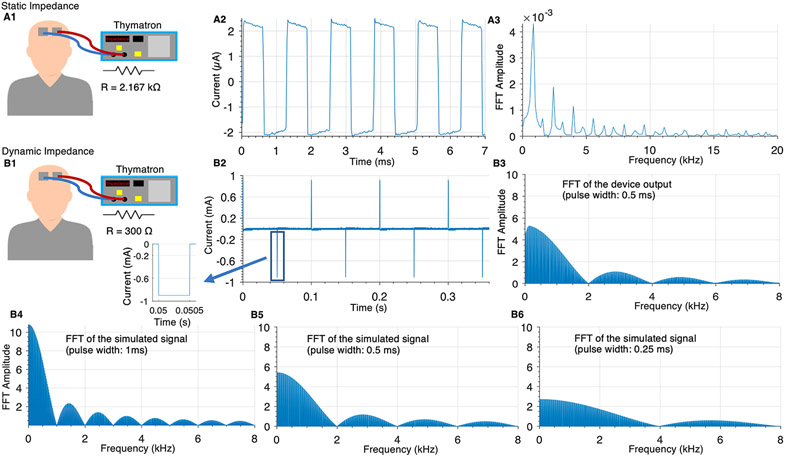
Fig. 2. Thymatron device waveform during static and ECT (dynamic) impedance measurements across resistors.
(A) Thymatron device static impedance measurement voltage across a 2.200 k Ω resistor that simulated human static impedance. The voltage divided by the resistance of the resistor gives the static impedance current waveform yielding the time-series waveform (~±2 μA peak square wave; A2) and its frequency content (A3). (B) Thymatron device dynamic impedance measurement voltage across a 300 Ω resistor to simulate human dynamic impedance. The voltage divided by the resistance of the resistor gives the dynamic impedance current yielding the time series (~±900 mA; B2) and its frequency content (B3). The frequency content of a simulated version of the idealized signal (Equation (2)) was calculated for different pulse widths (B4: 0.25 m s, B5: 0.5 m s; B6: 1 m s).

