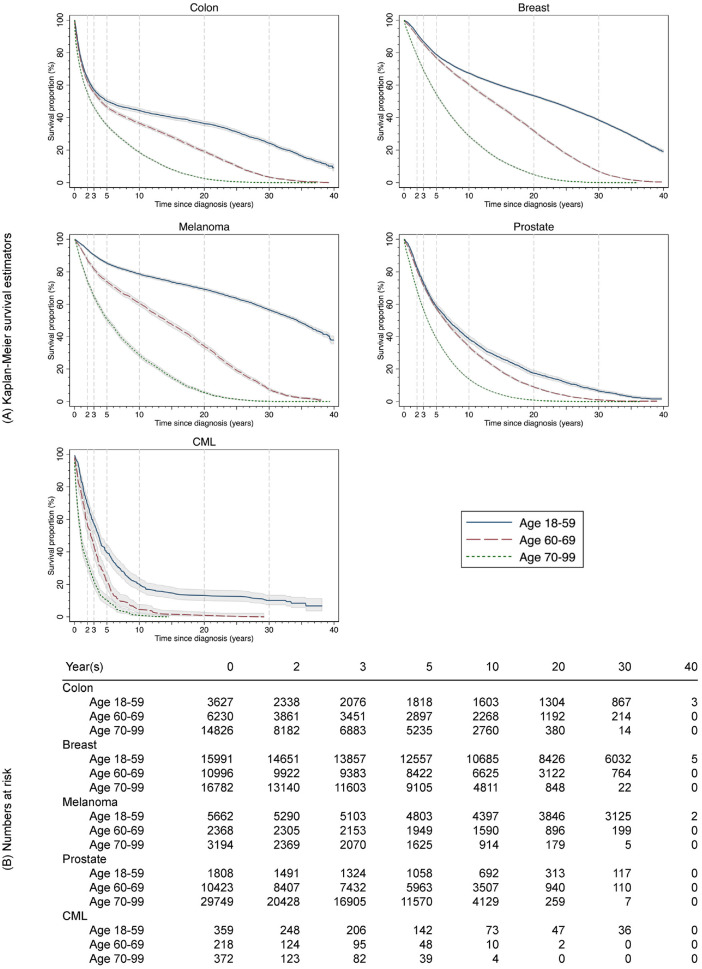
Figure 1.
(A) Kaplan-Meier survival estimates (lines) with 95% confidence intervals (shaded areas) and (B) numbers at risk for 15 cancer cohorts, diagnosis in Sweden during 1981-1990 with follow-up until 2020. Vertical dashed lines on plot (A) indicate time points at 2, 3, 5, 10, 20, and 30 years. CML, chronic myeloid leukemia.

