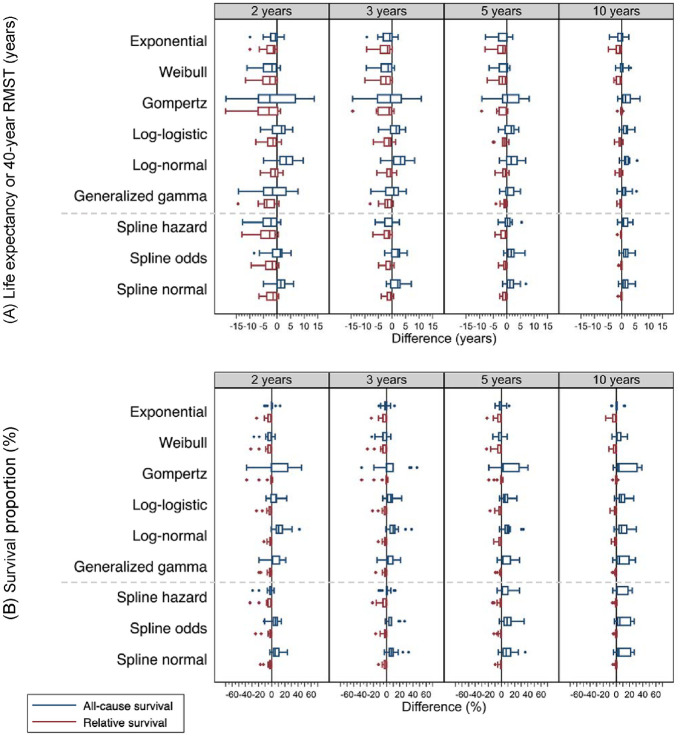
Figure 3.
Boxplots show difference (extrapolated minus observed) for (A) life expectancy (LE) or 40-year restricted mean survival time (RMST) (years) and (B) survival proportion (%) at 40 years across 15 cancer cohorts, by model, survival framework, and follow-up time used for extrapolation. The extrapolated values were retrieved from models fitted to 2, 3, 5, and 10 years of follow-up data and predicted to lifetime or 40 years. The observed values were from Kaplan-Meier survival estimates of 40 years. Boxplots in blue represent models using an all-cause survival framework, while those in red are using a relative survival framework. If survival proportion was not yet zero by 40 years, 40-year RMST was evaluated instead of LE.

