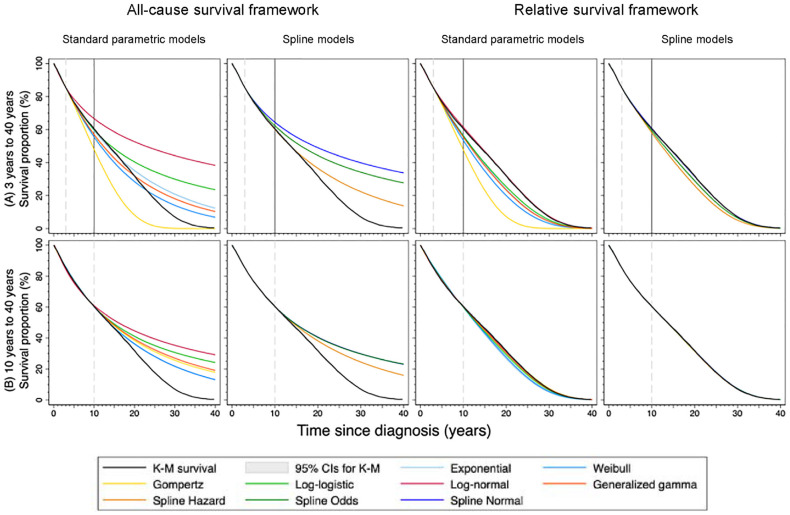
Figure 4.
Extrapolated survival curves (A) from 3 years to 40 years and (B) from 10 years to 40 years for breast cancer aged 60-69 years by model, survival framework, follow-up time use for extrapolation. The observed values (black lines) with 95% confidence intervals (shaded areas) were from Kaplan-Meier survival estimates of 40 years. The vertical solid line on plot (A) indicates 10 years. K-M, Kaplan-Meier; CIs, confidence intervals.

