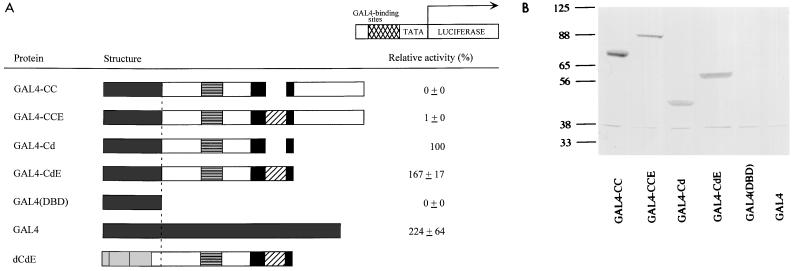
FIG. 3.
(A) Relative transactivation by GAL4-Myb fusion proteins. The schematic shows various GAL4-Myb fusion proteins; dCdE is included for comparison. For explanation of Myb sequences, see the legend to Fig. 1. A dashed line indicates the locations of fusions relative to that of dCdE. The reporter plasmid is shown at the top. GAL4-binding sites are indicated by a cross-hatched box. TATA, E1B TATA box; LUCIFERASE, luc gene. The transactivation by different activators is shown relative to GAL4-Cd, which is assigned a value of 100%. The data are represented as the mean of four experiments with average deviations of the mean. (B) Immunoblot of the GAL4-Myb fusion proteins in transfected QT6 fibroblasts. Normalized volumes of cell extracts from each sample were analyzed by SDS-PAGE and detected by a mixture of Myb monoclonal antibodies (2.2 and 2.7). The relative mobilities of molecular weight markers are indicated to the left in kilodaltons.

