FIGURE 2.

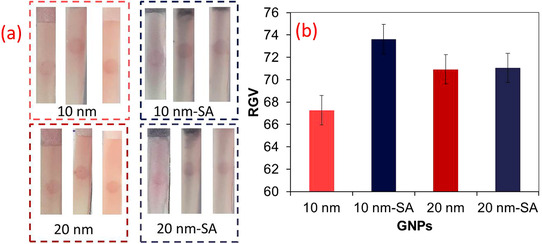
(a) Images of test zone of strips and (b) RGV values for test zone (n = 3, mean±SD), SA represents signal amplification by gold enhancement method

(a) Images of test zone of strips and (b) RGV values for test zone (n = 3, mean±SD), SA represents signal amplification by gold enhancement method