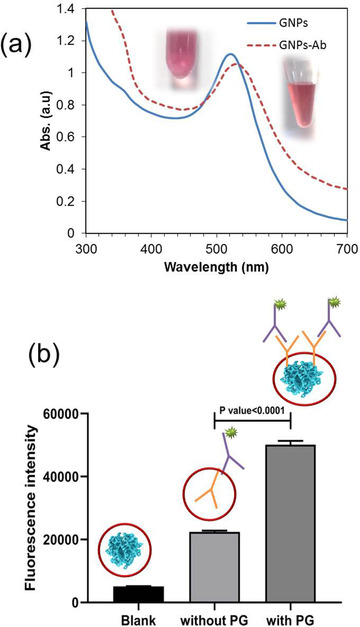
FIGURE 3.

(a) UV‐Vis absorption spectra for GNPs and GNPs‐Ab conjugate (insets show corresponded suspensions), (b) Fluorescence intensities obtained for microplate wells containing Blank (PG and BSA), and goat anti‐mouse IgG attached to rabbit anti‐goat IgG‐FITC in the absence and presence of PG
