FIGURE 4.

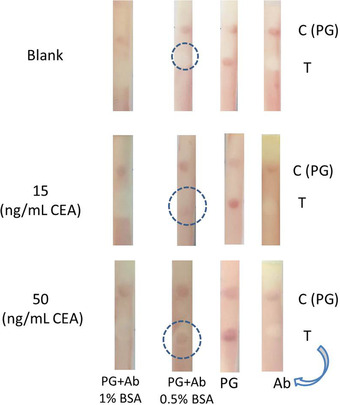
Lateral flow test strips representing the results obtained for different concentrations of CEA, 0 (Blank), 15, and 50 ng/mL when Ab, PG, and both of them were dropped on test zone and blocked by 0.5% and 1% BSA

Lateral flow test strips representing the results obtained for different concentrations of CEA, 0 (Blank), 15, and 50 ng/mL when Ab, PG, and both of them were dropped on test zone and blocked by 0.5% and 1% BSA