FIGURE 5.

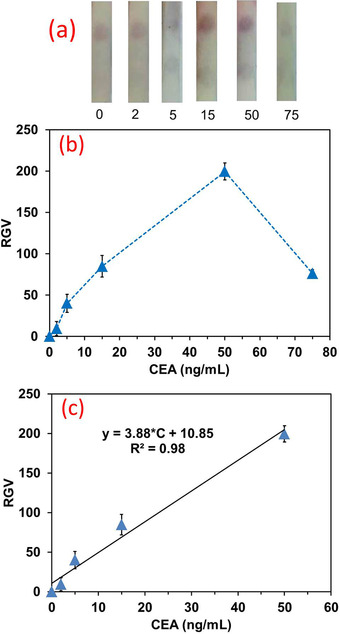
(a) Photographs representing the strips and test zones, and (b) the corresponding RGV vs. standard solutions of CEA, (c) Calibration graph within the range of 0 to 50 ng/mL

(a) Photographs representing the strips and test zones, and (b) the corresponding RGV vs. standard solutions of CEA, (c) Calibration graph within the range of 0 to 50 ng/mL