
FIGURE 6.
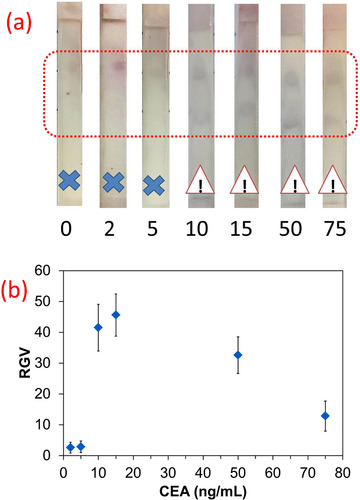
Photographs of strips after running with serum samples, showing a dark blue color in the test zone for concentrations higher than 10 ng/mL of CEA, (b) corresponding RGV vs. CEA (ng/mL) graph
Official websites use .gov
A
.gov website belongs to an official
government organization in the United States.
Secure .gov websites use HTTPS
A lock (
) or https:// means you've safely
connected to the .gov website. Share sensitive
information only on official, secure websites.
Photographs of strips after running with serum samples, showing a dark blue color in the test zone for concentrations higher than 10 ng/mL of CEA, (b) corresponding RGV vs. CEA (ng/mL) graph