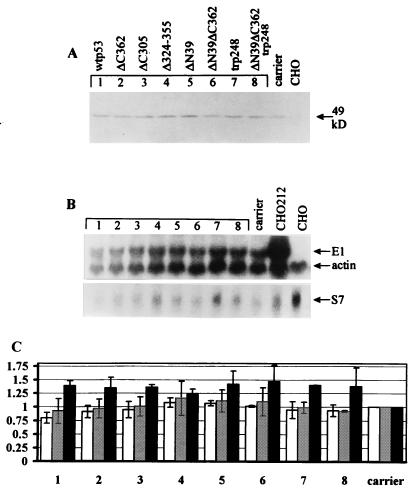
FIG. 5.
Expression of p53 does not affect the level of E1 and E2 expression. A p53 expression construct (500 ng) was electroporated into CHO4.15 cells. In panels B and C, lanes and columns 1 to 8 represent transfections with different p53 mutants in the same order as in panel A. carrier, control with carrier DNA only; CHO, mock-transfected CHO cells (lacking both E1 and E2 expression). All analyses were performed 48 h posttransfection. (A) Western blot analysis of the E2 protein levels in p53-transfected CHO4.15 cells, using a mixture of five different E2-specific monoclonal antibodies (see Materials and Methods). (B) Northern blot analysis of the endogenous E1 mRNA levels in total RNA preparations from transfected CHO4.15 cells. CHO212, total RNA from E1-expressing cell line CHO212. The same filter was probed first with radiolabeled E1- and β-actin-specific probes and then reprobed with ribosomal protein S7-specific probe. Approximate lengths for mRNAs are 700 bp for S7, 2.0 kb for β-actin and 2.3 kb for E1. (C) Quantitation of the E1 Northern blots and E2 gel shift assay with a PhosphorImager. The E1 mRNA-specific signals in the total RNA preparations were normalized to the β-actin (open columns) and ribosomal protein S7 (shaded columns) mRNA signals in the RNA samples. Black columns represent the E2 gel shift data. The E2-specific signal in the lysates of the mock-transfected cells and the normalized E1 mRNA-specific signal from carrier-transfected control cells were set at 1.0 in each experimental series. Each column represents the average of two independent experiments.

