
Figure 1.
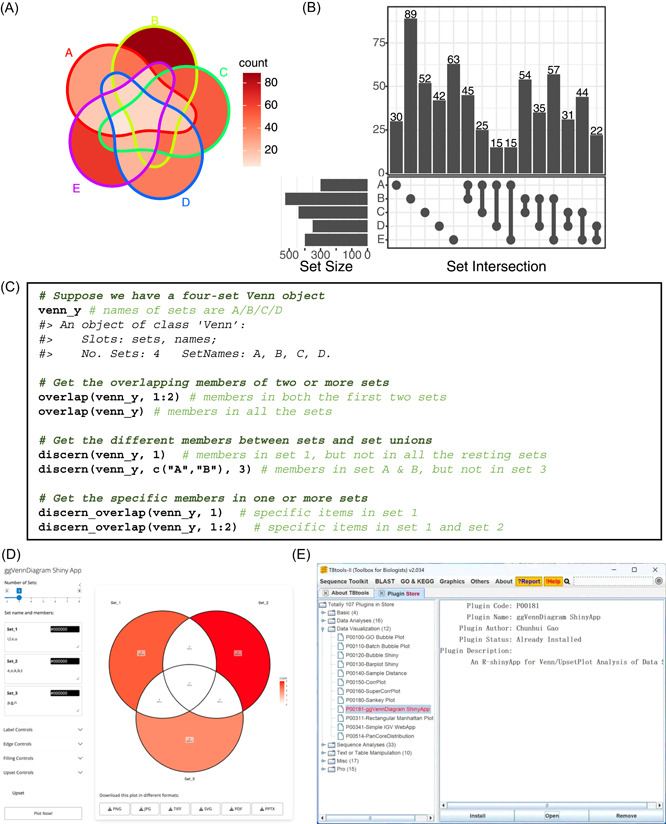
Features of ggVennDiagram. Venn diagram (A) and upset plot (B) with five sets input. (A) The numbers of subset members can be distinguished by light and deep red color fillings. (B) Top plot shows the size of intersections; left plot shows the size of five sets; main plot shows what these intersections come from. Intersections and sets were sorted alphabetically. (C) Example of Venn calculator. User can easily access the subsets with Venn object and generic methods. A reproducible example is provided in File S1. Screenshot of the ggVennDiagram Shiny App (D) and ggVennDiagram plugin in TBtools (E).