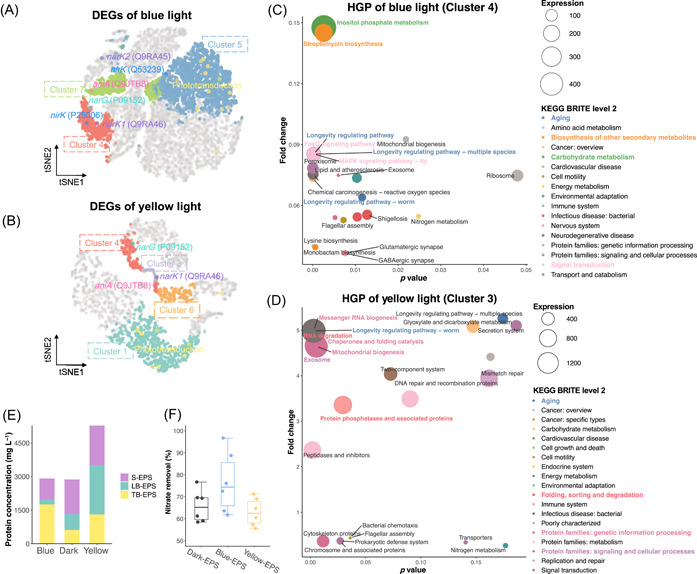
Figure 4.

Decrypting hub gene panels (HGPs) and signaling gene panels (SGPs) to predict phenotype and the corresponding wet‐lab validations. (A, B) Spatial distribution of functional clusters and significant photo‐denitrification genes of blue (A) and yellow light (B). (C, D) Pathways enrichment analysis of HGPs of blue (C) and yellow (D) light. The most highly expressed pathways and their KEGG BRITE (KEGG database) were highlighted by corresponding color and bold font. Bubble size denoted mean expression levels (FPKM) under blue or yellow light, respectively. Fold changes were calculated with the dark group as the control. (E) Protein concentrations of stratified extracellular polymer substances (EPSs) under different illumination conditions. The thin white lines on the stacked bar separated the results of triplicates. (F) Self‐catalysis experiments. EPS under dark, blue, and yellow light conditions were added to the model denitrifier systems. DEG, differentially expressed gene; KEGG, Kyoto Encyclopedia of Genes and Genomes; LB‐EPS, loosely bound EPS; S‐EPS, soluble EPS; TB‐EPS, tightly bound EPS; tSNE, T‐distributed stochastic neighbor embedding.
