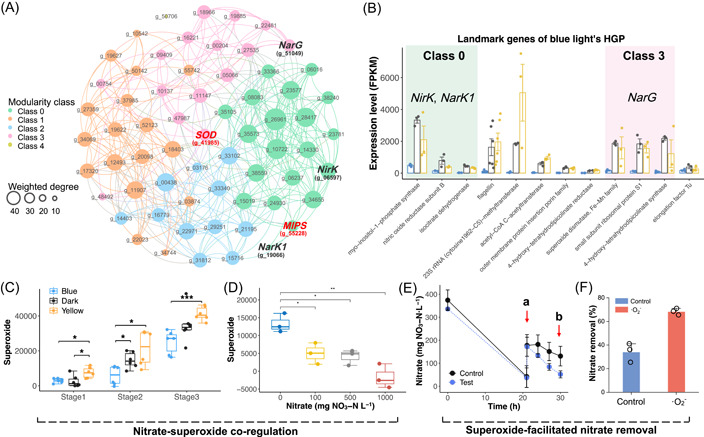
Figure 5.

Exploiting landmark genes of gene topological networks to develop a regulatory strategy on nitrate reduction. (A) The gene topological network of blue light's HGP. Details on the topological information of gene nodes and landmark genes were summarized in Dataset S1 to S6. The bold red font highlighted the most highly expressed landmark genes. The bold black font highlighted the PD genes. (B) Expression levels of landmark genes of blue light's HGP. Background highlights the modularity class that crucial denitrification genes are subjected to. The different background colors represented different modularity classes. (C) Stage 1, nitrate reduction; Stage 2, nitrite reduction; Stage 3, Inorganic nitrogen depletion. (D) Superoxide production under different initial nitrate concentrations. (E) Superoxide supplementation experiment. At timepoint a, nitrate and superoxide were added. Timepoint b was used to calculate the effects of superoxide on nitrate removal efficiency. Both control and superoxide groups were conducted under dark conditions. (F) Effect of superoxide supplementation on nitrate removal efficiency. DapA, 4‐hydroxy‐tetrahydrodipicolinate synthase; HGP, hub gene panel; IDH, isocitrate dehydrogenase; MIPS, myo‐inositol‐1‐phosphate synthase; NarG, nitrate reductase; NarK1, nitrate/nitrite transporter; NirK, nitrite reductase; NorB, nitric oxide reductase subunit B; PD, partial denitrificatio; SOD, superoxide dismutase.
